Immigrants from Venezuela vs White/Caucasian Female Poverty Among 25-34 Year Olds
COMPARE
Immigrants from Venezuela
White/Caucasian
Female Poverty Among 25-34 Year Olds
Female Poverty Among 25-34 Year Olds Comparison
Immigrants from Venezuela
Whites/Caucasians
13.6%
FEMALE POVERTY AMONG 25-34 YEAR OLDS
40.7/ 100
METRIC RATING
182nd/ 347
METRIC RANK
14.7%
FEMALE POVERTY AMONG 25-34 YEAR OLDS
1.8/ 100
METRIC RATING
233rd/ 347
METRIC RANK
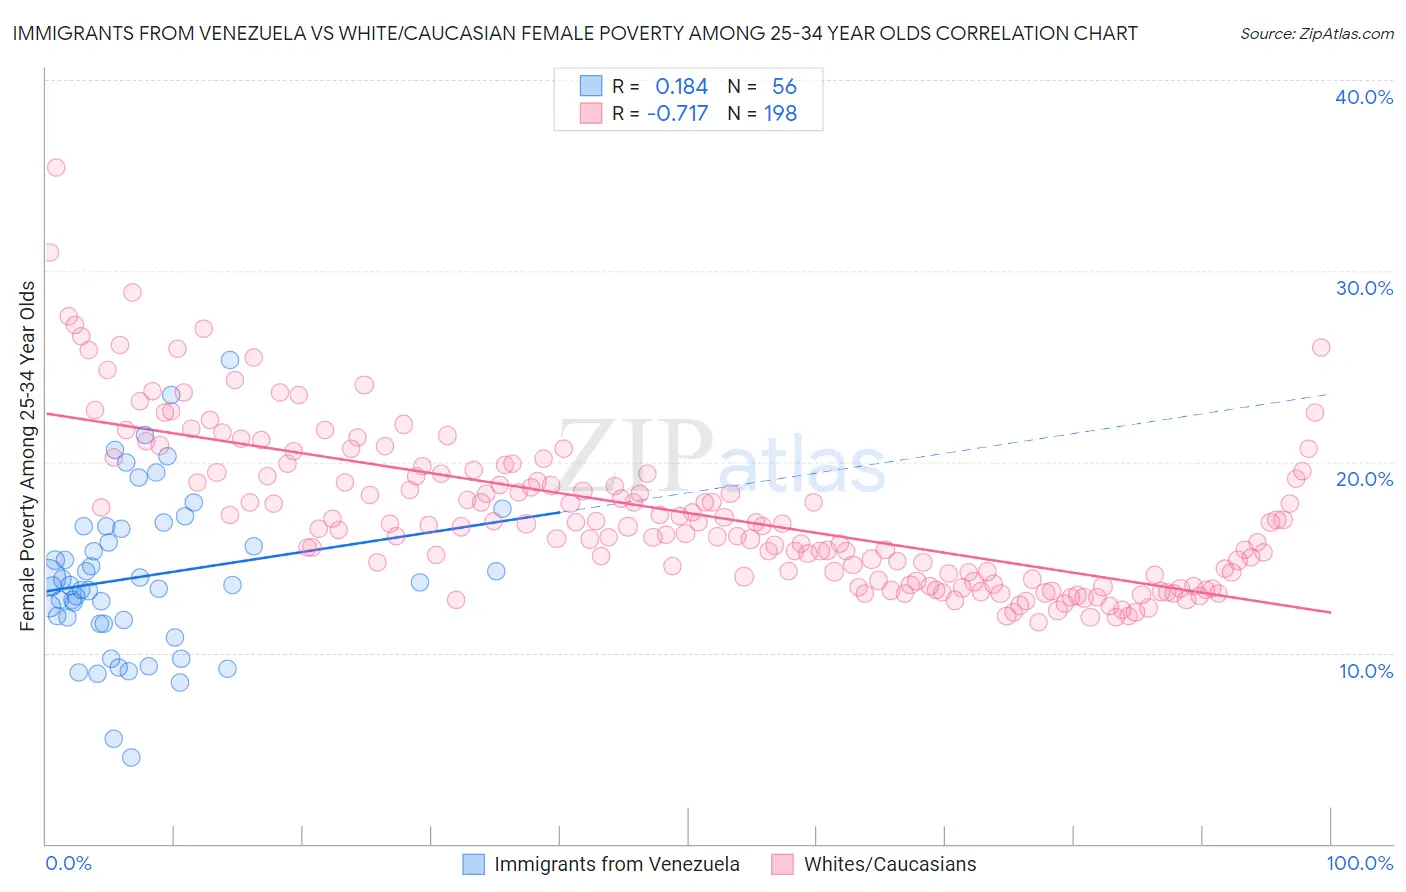
Immigrants from Venezuela vs White/Caucasian Female Poverty Among 25-34 Year Olds Correlation Chart
The statistical analysis conducted on geographies consisting of 285,242,429 people shows a poor positive correlation between the proportion of Immigrants from Venezuela and poverty level among females between the ages 25 and 34 in the United States with a correlation coefficient (R) of 0.184 and weighted average of 13.6%. Similarly, the statistical analysis conducted on geographies consisting of 558,401,986 people shows a strong negative correlation between the proportion of Whites/Caucasians and poverty level among females between the ages 25 and 34 in the United States with a correlation coefficient (R) of -0.717 and weighted average of 14.7%, a difference of 7.5%.
Female Poverty Among 25-34 Year Olds Correlation Summary
| Measurement | Immigrants from Venezuela | White/Caucasian |
| Minimum | 4.5% | 11.6% |
| Maximum | 25.3% | 35.4% |
| Range | 20.8% | 23.8% |
| Mean | 14.0% | 17.3% |
| Median | 13.5% | 16.7% |
| Interquartile 25% (IQ1) | 11.6% | 13.9% |
| Interquartile 75% (IQ3) | 16.6% | 19.4% |
| Interquartile Range (IQR) | 4.9% | 5.6% |
| Standard Deviation (Sample) | 4.2% | 4.2% |
| Standard Deviation (Population) | 4.1% | 4.2% |
Similar Demographics by Female Poverty Among 25-34 Year Olds
Demographics Similar to Immigrants from Venezuela by Female Poverty Among 25-34 Year Olds
In terms of female poverty among 25-34 year olds, the demographic groups most similar to Immigrants from Venezuela are Portuguese (13.6%, a difference of 0.030%), German (13.6%, a difference of 0.070%), Guamanian/Chamorro (13.6%, a difference of 0.070%), Immigrants from Eastern Africa (13.6%, a difference of 0.24%), and Canadian (13.6%, a difference of 0.30%).
| Demographics | Rating | Rank | Female Poverty Among 25-34 Year Olds |
| Bermudans | 46.8 /100 | #175 | Average 13.6% |
| Yugoslavians | 45.0 /100 | #176 | Average 13.6% |
| Venezuelans | 44.6 /100 | #177 | Average 13.6% |
| Canadians | 44.3 /100 | #178 | Average 13.6% |
| Immigrants | Eastern Africa | 43.6 /100 | #179 | Average 13.6% |
| Germans | 41.6 /100 | #180 | Average 13.6% |
| Guamanians/Chamorros | 41.5 /100 | #181 | Average 13.6% |
| Immigrants | Venezuela | 40.7 /100 | #182 | Average 13.6% |
| Portuguese | 40.3 /100 | #183 | Average 13.6% |
| Czechoslovakians | 36.8 /100 | #184 | Fair 13.7% |
| Irish | 35.3 /100 | #185 | Fair 13.7% |
| Immigrants | Uruguay | 34.1 /100 | #186 | Fair 13.7% |
| Slovaks | 34.1 /100 | #187 | Fair 13.7% |
| Immigrants | Eritrea | 32.7 /100 | #188 | Fair 13.7% |
| Finns | 32.5 /100 | #189 | Fair 13.7% |
Demographics Similar to Whites/Caucasians by Female Poverty Among 25-34 Year Olds
In terms of female poverty among 25-34 year olds, the demographic groups most similar to Whites/Caucasians are Immigrants from Ecuador (14.6%, a difference of 0.18%), Cuban (14.7%, a difference of 0.23%), Immigrants from Jamaica (14.7%, a difference of 0.41%), Salvadoran (14.7%, a difference of 0.43%), and Immigrants from Ghana (14.7%, a difference of 0.43%).
| Demographics | Rating | Rank | Female Poverty Among 25-34 Year Olds |
| Nicaraguans | 3.3 /100 | #226 | Tragic 14.5% |
| Celtics | 2.8 /100 | #227 | Tragic 14.5% |
| Vietnamese | 2.6 /100 | #228 | Tragic 14.6% |
| Spanish | 2.5 /100 | #229 | Tragic 14.6% |
| Spaniards | 2.3 /100 | #230 | Tragic 14.6% |
| Delaware | 2.3 /100 | #231 | Tragic 14.6% |
| Immigrants | Ecuador | 1.9 /100 | #232 | Tragic 14.6% |
| Whites/Caucasians | 1.8 /100 | #233 | Tragic 14.7% |
| Cubans | 1.6 /100 | #234 | Tragic 14.7% |
| Immigrants | Jamaica | 1.4 /100 | #235 | Tragic 14.7% |
| Salvadorans | 1.4 /100 | #236 | Tragic 14.7% |
| Immigrants | Ghana | 1.4 /100 | #237 | Tragic 14.7% |
| Alsatians | 1.4 /100 | #238 | Tragic 14.7% |
| Malaysians | 1.4 /100 | #239 | Tragic 14.7% |
| Immigrants | Grenada | 1.3 /100 | #240 | Tragic 14.7% |