Canadian vs French Median Male Earnings
COMPARE
Canadian
French
Median Male Earnings
Median Male Earnings Comparison
Canadians
French
$57,286
MEDIAN MALE EARNINGS
93.9/ 100
METRIC RATING
120th/ 347
METRIC RANK
$55,350
MEDIAN MALE EARNINGS
69.9/ 100
METRIC RATING
162nd/ 347
METRIC RANK
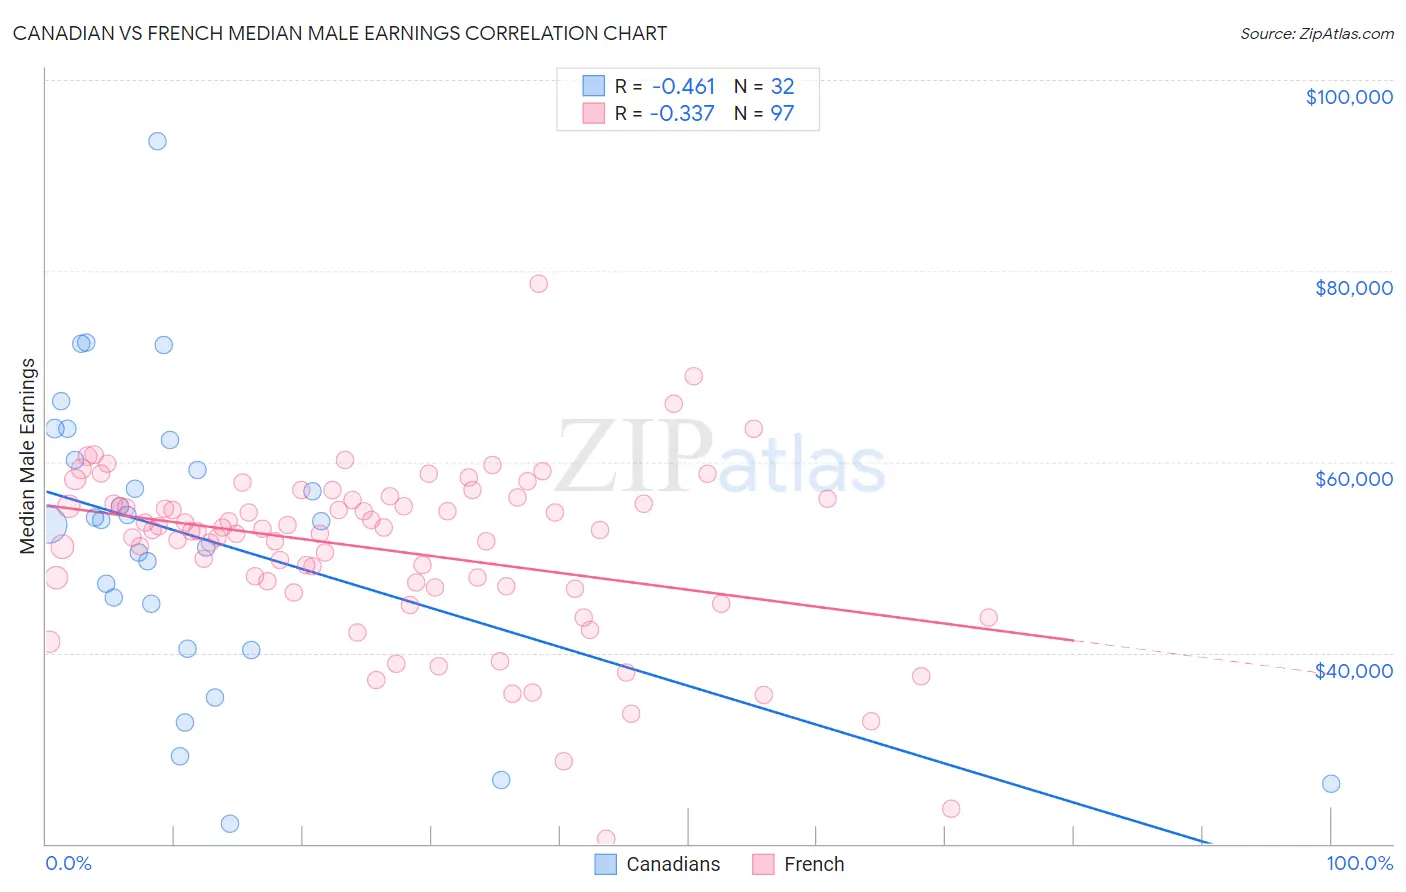
Canadian vs French Median Male Earnings Correlation Chart
The statistical analysis conducted on geographies consisting of 437,343,758 people shows a moderate negative correlation between the proportion of Canadians and median male earnings in the United States with a correlation coefficient (R) of -0.461 and weighted average of $57,286. Similarly, the statistical analysis conducted on geographies consisting of 571,095,815 people shows a mild negative correlation between the proportion of French and median male earnings in the United States with a correlation coefficient (R) of -0.337 and weighted average of $55,350, a difference of 3.5%.
Median Male Earnings Correlation Summary
| Measurement | Canadian | French |
| Minimum | $22,125 | $20,556 |
| Maximum | $93,638 | $78,663 |
| Range | $71,513 | $58,107 |
| Mean | $52,093 | $50,816 |
| Median | $53,822 | $52,806 |
| Interquartile 25% (IQ1) | $42,789 | $46,933 |
| Interquartile 75% (IQ3) | $61,239 | $56,096 |
| Interquartile Range (IQR) | $18,449 | $9,162 |
| Standard Deviation (Sample) | $15,572 | $9,122 |
| Standard Deviation (Population) | $15,327 | $9,075 |
Similar Demographics by Median Male Earnings
Demographics Similar to Canadians by Median Male Earnings
In terms of median male earnings, the demographic groups most similar to Canadians are Arab ($57,298, a difference of 0.020%), Hungarian ($57,309, a difference of 0.040%), Immigrants from Zimbabwe ($57,352, a difference of 0.12%), Immigrants from Albania ($57,179, a difference of 0.19%), and Lebanese ($57,409, a difference of 0.22%).
| Demographics | Rating | Rank | Median Male Earnings |
| Carpatho Rusyns | 95.3 /100 | #113 | Exceptional $57,572 |
| Immigrants | Kuwait | 95.3 /100 | #114 | Exceptional $57,562 |
| Swedes | 94.8 /100 | #115 | Exceptional $57,445 |
| Lebanese | 94.6 /100 | #116 | Exceptional $57,409 |
| Immigrants | Zimbabwe | 94.3 /100 | #117 | Exceptional $57,352 |
| Hungarians | 94.0 /100 | #118 | Exceptional $57,309 |
| Arabs | 94.0 /100 | #119 | Exceptional $57,298 |
| Canadians | 93.9 /100 | #120 | Exceptional $57,286 |
| Immigrants | Albania | 93.3 /100 | #121 | Exceptional $57,179 |
| Immigrants | Jordan | 93.1 /100 | #122 | Exceptional $57,145 |
| Slovenes | 93.1 /100 | #123 | Exceptional $57,145 |
| Chileans | 91.9 /100 | #124 | Exceptional $56,973 |
| Immigrants | Morocco | 91.8 /100 | #125 | Exceptional $56,958 |
| Chinese | 91.1 /100 | #126 | Exceptional $56,872 |
| Brazilians | 90.9 /100 | #127 | Exceptional $56,837 |
Demographics Similar to French by Median Male Earnings
In terms of median male earnings, the demographic groups most similar to French are Belgian ($55,361, a difference of 0.020%), Basque ($55,370, a difference of 0.040%), Alsatian ($55,380, a difference of 0.050%), Czechoslovakian ($55,382, a difference of 0.060%), and Ugandan ($55,290, a difference of 0.11%).
| Demographics | Rating | Rank | Median Male Earnings |
| Scandinavians | 73.4 /100 | #155 | Good $55,527 |
| Immigrants | Ethiopia | 71.6 /100 | #156 | Good $55,434 |
| Icelanders | 71.2 /100 | #157 | Good $55,415 |
| Czechoslovakians | 70.5 /100 | #158 | Good $55,382 |
| Alsatians | 70.5 /100 | #159 | Good $55,380 |
| Basques | 70.3 /100 | #160 | Good $55,370 |
| Belgians | 70.1 /100 | #161 | Good $55,361 |
| French | 69.9 /100 | #162 | Good $55,350 |
| Ugandans | 68.6 /100 | #163 | Good $55,290 |
| Immigrants | South Eastern Asia | 67.6 /100 | #164 | Good $55,241 |
| Immigrants | Portugal | 66.3 /100 | #165 | Good $55,182 |
| Germans | 61.6 /100 | #166 | Good $54,974 |
| Immigrants | Fiji | 61.2 /100 | #167 | Good $54,958 |
| Immigrants | Vietnam | 60.2 /100 | #168 | Good $54,913 |
| French Canadians | 55.6 /100 | #169 | Average $54,722 |