Immigrants from Venezuela vs French American Indian Householder Income Over 65 years
COMPARE
Immigrants from Venezuela
French American Indian
Householder Income Over 65 years
Householder Income Over 65 years Comparison
Immigrants from Venezuela
French American Indians
$57,371
HOUSEHOLDER INCOME OVER 65 YEARS
2.3/ 100
METRIC RATING
232nd/ 347
METRIC RANK
$54,699
HOUSEHOLDER INCOME OVER 65 YEARS
0.1/ 100
METRIC RATING
263rd/ 347
METRIC RANK
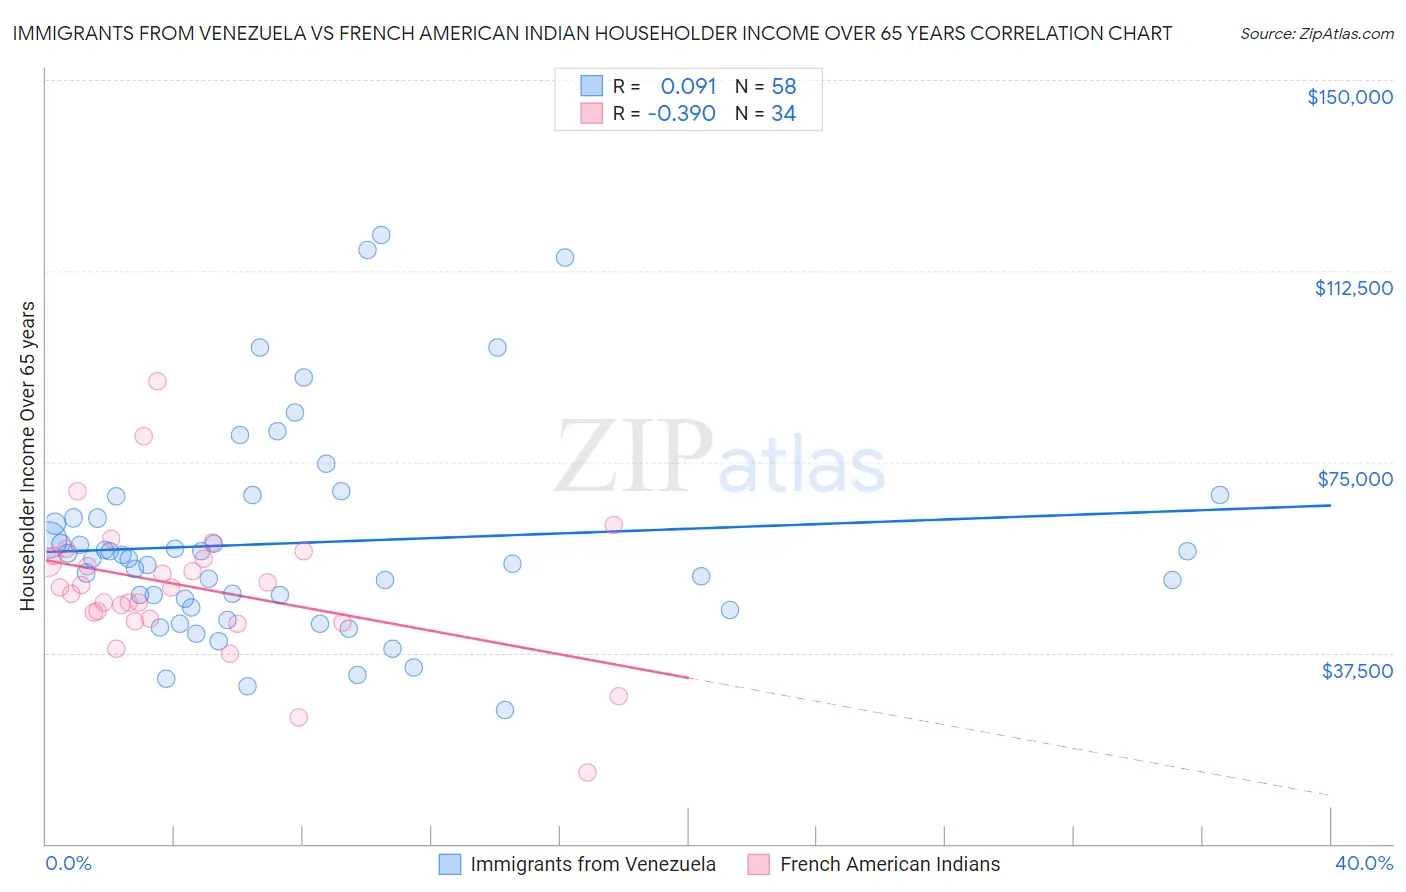
Immigrants from Venezuela vs French American Indian Householder Income Over 65 years Correlation Chart
The statistical analysis conducted on geographies consisting of 287,361,159 people shows a slight positive correlation between the proportion of Immigrants from Venezuela and household income with householder over the age of 65 in the United States with a correlation coefficient (R) of 0.091 and weighted average of $57,371. Similarly, the statistical analysis conducted on geographies consisting of 131,860,683 people shows a mild negative correlation between the proportion of French American Indians and household income with householder over the age of 65 in the United States with a correlation coefficient (R) of -0.390 and weighted average of $54,699, a difference of 4.9%.
Householder Income Over 65 years Correlation Summary
| Measurement | Immigrants from Venezuela | French American Indian |
| Minimum | $26,376 | $13,958 |
| Maximum | $119,643 | $90,764 |
| Range | $93,267 | $76,806 |
| Mean | $59,079 | $50,471 |
| Median | $55,975 | $50,313 |
| Interquartile 25% (IQ1) | $46,366 | $44,258 |
| Interquartile 75% (IQ3) | $63,983 | $56,532 |
| Interquartile Range (IQR) | $17,617 | $12,274 |
| Standard Deviation (Sample) | $20,462 | $13,962 |
| Standard Deviation (Population) | $20,285 | $13,755 |
Similar Demographics by Householder Income Over 65 years
Demographics Similar to Immigrants from Venezuela by Householder Income Over 65 years
In terms of householder income over 65 years, the demographic groups most similar to Immigrants from Venezuela are Nonimmigrants ($57,426, a difference of 0.090%), Immigrants from Cambodia ($57,580, a difference of 0.36%), Immigrants from Western Africa ($57,119, a difference of 0.44%), Immigrants from Burma/Myanmar ($57,114, a difference of 0.45%), and Immigrants from Colombia ($57,658, a difference of 0.50%).
| Demographics | Rating | Rank | Householder Income Over 65 years |
| Venezuelans | 4.4 /100 | #225 | Tragic $58,026 |
| French Canadians | 4.2 /100 | #226 | Tragic $57,975 |
| Japanese | 3.9 /100 | #227 | Tragic $57,919 |
| Immigrants | Albania | 3.6 /100 | #228 | Tragic $57,828 |
| Immigrants | Colombia | 3.0 /100 | #229 | Tragic $57,658 |
| Immigrants | Cambodia | 2.8 /100 | #230 | Tragic $57,580 |
| Immigrants | Nonimmigrants | 2.4 /100 | #231 | Tragic $57,426 |
| Immigrants | Venezuela | 2.3 /100 | #232 | Tragic $57,371 |
| Immigrants | Western Africa | 1.7 /100 | #233 | Tragic $57,119 |
| Immigrants | Burma/Myanmar | 1.7 /100 | #234 | Tragic $57,114 |
| Spanish Americans | 1.6 /100 | #235 | Tragic $57,021 |
| Immigrants | Uruguay | 1.5 /100 | #236 | Tragic $56,975 |
| Immigrants | Panama | 1.5 /100 | #237 | Tragic $56,944 |
| Fijians | 1.2 /100 | #238 | Tragic $56,768 |
| Immigrants | Laos | 1.2 /100 | #239 | Tragic $56,722 |
Demographics Similar to French American Indians by Householder Income Over 65 years
In terms of householder income over 65 years, the demographic groups most similar to French American Indians are Bangladeshi ($54,719, a difference of 0.040%), Apache ($54,668, a difference of 0.060%), Belizean ($54,580, a difference of 0.22%), Jamaican ($54,560, a difference of 0.25%), and Guatemalan ($54,526, a difference of 0.32%).
| Demographics | Rating | Rank | Householder Income Over 65 years |
| German Russians | 0.3 /100 | #256 | Tragic $55,356 |
| Trinidadians and Tobagonians | 0.3 /100 | #257 | Tragic $55,327 |
| Ecuadorians | 0.2 /100 | #258 | Tragic $54,958 |
| West Indians | 0.2 /100 | #259 | Tragic $54,936 |
| Immigrants | West Indies | 0.2 /100 | #260 | Tragic $54,927 |
| Comanche | 0.2 /100 | #261 | Tragic $54,922 |
| Bangladeshis | 0.1 /100 | #262 | Tragic $54,719 |
| French American Indians | 0.1 /100 | #263 | Tragic $54,699 |
| Apache | 0.1 /100 | #264 | Tragic $54,668 |
| Belizeans | 0.1 /100 | #265 | Tragic $54,580 |
| Jamaicans | 0.1 /100 | #266 | Tragic $54,560 |
| Guatemalans | 0.1 /100 | #267 | Tragic $54,526 |
| Immigrants | Zaire | 0.1 /100 | #268 | Tragic $54,512 |
| Nicaraguans | 0.1 /100 | #269 | Tragic $54,474 |
| Immigrants | Senegal | 0.1 /100 | #270 | Tragic $54,447 |