Immigrants from Venezuela vs Immigrants from Armenia Householder Income Over 65 years
COMPARE
Immigrants from Venezuela
Immigrants from Armenia
Householder Income Over 65 years
Householder Income Over 65 years Comparison
Immigrants from Venezuela
Immigrants from Armenia
$57,371
HOUSEHOLDER INCOME OVER 65 YEARS
2.3/ 100
METRIC RATING
232nd/ 347
METRIC RANK
$53,974
HOUSEHOLDER INCOME OVER 65 YEARS
0.1/ 100
METRIC RATING
282nd/ 347
METRIC RANK
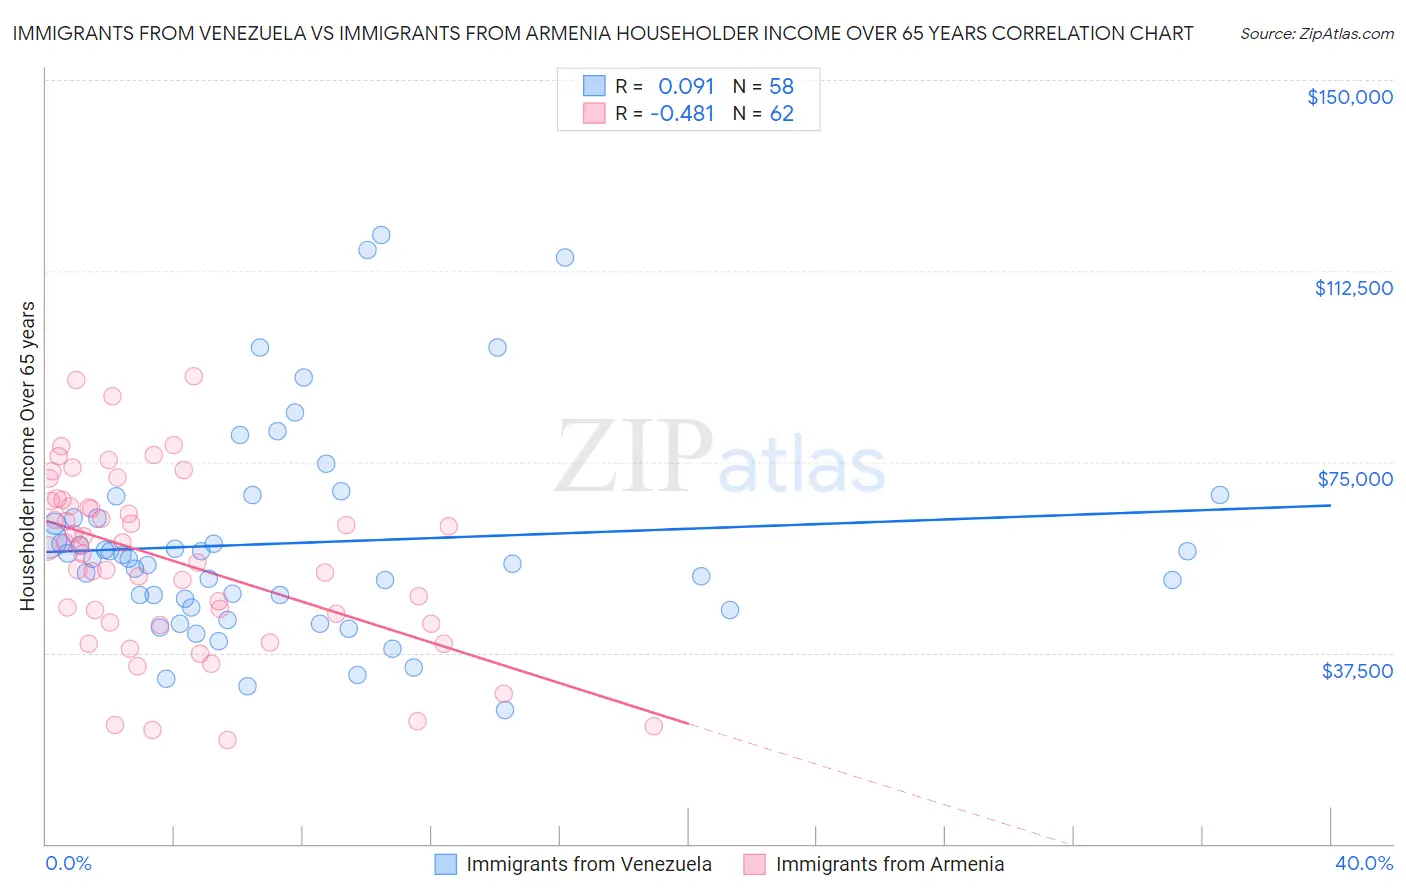
Immigrants from Venezuela vs Immigrants from Armenia Householder Income Over 65 years Correlation Chart
The statistical analysis conducted on geographies consisting of 287,361,159 people shows a slight positive correlation between the proportion of Immigrants from Venezuela and household income with householder over the age of 65 in the United States with a correlation coefficient (R) of 0.091 and weighted average of $57,371. Similarly, the statistical analysis conducted on geographies consisting of 97,641,472 people shows a moderate negative correlation between the proportion of Immigrants from Armenia and household income with householder over the age of 65 in the United States with a correlation coefficient (R) of -0.481 and weighted average of $53,974, a difference of 6.3%.
Householder Income Over 65 years Correlation Summary
| Measurement | Immigrants from Venezuela | Immigrants from Armenia |
| Minimum | $26,376 | $20,326 |
| Maximum | $119,643 | $91,930 |
| Range | $93,267 | $71,604 |
| Mean | $59,079 | $55,908 |
| Median | $55,975 | $58,257 |
| Interquartile 25% (IQ1) | $46,366 | $43,365 |
| Interquartile 75% (IQ3) | $63,983 | $67,262 |
| Interquartile Range (IQR) | $17,617 | $23,897 |
| Standard Deviation (Sample) | $20,462 | $17,185 |
| Standard Deviation (Population) | $20,285 | $17,046 |
Similar Demographics by Householder Income Over 65 years
Demographics Similar to Immigrants from Venezuela by Householder Income Over 65 years
In terms of householder income over 65 years, the demographic groups most similar to Immigrants from Venezuela are Nonimmigrants ($57,426, a difference of 0.090%), Immigrants from Cambodia ($57,580, a difference of 0.36%), Immigrants from Western Africa ($57,119, a difference of 0.44%), Immigrants from Burma/Myanmar ($57,114, a difference of 0.45%), and Immigrants from Colombia ($57,658, a difference of 0.50%).
| Demographics | Rating | Rank | Householder Income Over 65 years |
| Venezuelans | 4.4 /100 | #225 | Tragic $58,026 |
| French Canadians | 4.2 /100 | #226 | Tragic $57,975 |
| Japanese | 3.9 /100 | #227 | Tragic $57,919 |
| Immigrants | Albania | 3.6 /100 | #228 | Tragic $57,828 |
| Immigrants | Colombia | 3.0 /100 | #229 | Tragic $57,658 |
| Immigrants | Cambodia | 2.8 /100 | #230 | Tragic $57,580 |
| Immigrants | Nonimmigrants | 2.4 /100 | #231 | Tragic $57,426 |
| Immigrants | Venezuela | 2.3 /100 | #232 | Tragic $57,371 |
| Immigrants | Western Africa | 1.7 /100 | #233 | Tragic $57,119 |
| Immigrants | Burma/Myanmar | 1.7 /100 | #234 | Tragic $57,114 |
| Spanish Americans | 1.6 /100 | #235 | Tragic $57,021 |
| Immigrants | Uruguay | 1.5 /100 | #236 | Tragic $56,975 |
| Immigrants | Panama | 1.5 /100 | #237 | Tragic $56,944 |
| Fijians | 1.2 /100 | #238 | Tragic $56,768 |
| Immigrants | Laos | 1.2 /100 | #239 | Tragic $56,722 |
Demographics Similar to Immigrants from Armenia by Householder Income Over 65 years
In terms of householder income over 65 years, the demographic groups most similar to Immigrants from Armenia are Immigrants from Liberia ($53,967, a difference of 0.010%), Immigrants from Guatemala ($53,950, a difference of 0.040%), Somali ($54,004, a difference of 0.060%), Immigrants from Ecuador ($54,030, a difference of 0.10%), and Blackfeet ($54,029, a difference of 0.10%).
| Demographics | Rating | Rank | Householder Income Over 65 years |
| Cherokee | 0.1 /100 | #275 | Tragic $54,133 |
| Cree | 0.1 /100 | #276 | Tragic $54,129 |
| Cheyenne | 0.1 /100 | #277 | Tragic $54,096 |
| Immigrants | Ecuador | 0.1 /100 | #278 | Tragic $54,030 |
| Blackfeet | 0.1 /100 | #279 | Tragic $54,029 |
| Immigrants | Jamaica | 0.1 /100 | #280 | Tragic $54,027 |
| Somalis | 0.1 /100 | #281 | Tragic $54,004 |
| Immigrants | Armenia | 0.1 /100 | #282 | Tragic $53,974 |
| Immigrants | Liberia | 0.1 /100 | #283 | Tragic $53,967 |
| Immigrants | Guatemala | 0.1 /100 | #284 | Tragic $53,950 |
| Mexicans | 0.1 /100 | #285 | Tragic $53,897 |
| Chippewa | 0.1 /100 | #286 | Tragic $53,847 |
| Immigrants | Barbados | 0.1 /100 | #287 | Tragic $53,766 |
| Paiute | 0.1 /100 | #288 | Tragic $53,762 |
| Iroquois | 0.1 /100 | #289 | Tragic $53,737 |