U.S. Virgin Islander vs French American Indian Householder Income Over 65 years
COMPARE
U.S. Virgin Islander
French American Indian
Householder Income Over 65 years
Householder Income Over 65 years Comparison
U.S. Virgin Islanders
French American Indians
$52,072
HOUSEHOLDER INCOME OVER 65 YEARS
0.0/ 100
METRIC RATING
315th/ 347
METRIC RANK
$54,699
HOUSEHOLDER INCOME OVER 65 YEARS
0.1/ 100
METRIC RATING
263rd/ 347
METRIC RANK
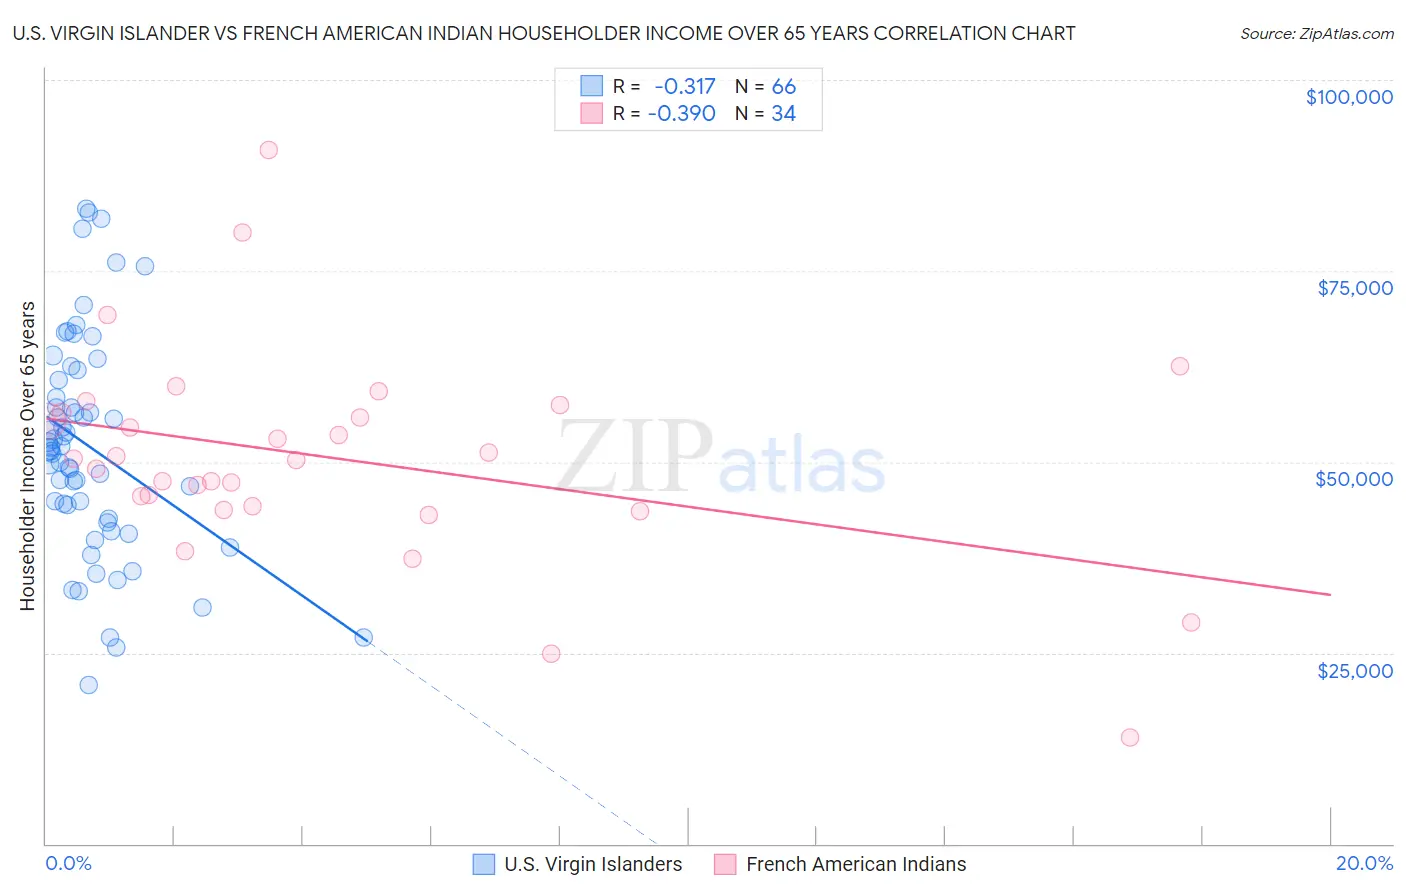
U.S. Virgin Islander vs French American Indian Householder Income Over 65 years Correlation Chart
The statistical analysis conducted on geographies consisting of 87,439,612 people shows a mild negative correlation between the proportion of U.S. Virgin Islanders and household income with householder over the age of 65 in the United States with a correlation coefficient (R) of -0.317 and weighted average of $52,072. Similarly, the statistical analysis conducted on geographies consisting of 131,860,683 people shows a mild negative correlation between the proportion of French American Indians and household income with householder over the age of 65 in the United States with a correlation coefficient (R) of -0.390 and weighted average of $54,699, a difference of 5.0%.
Householder Income Over 65 years Correlation Summary
| Measurement | U.S. Virgin Islander | French American Indian |
| Minimum | $20,842 | $13,958 |
| Maximum | $83,077 | $90,764 |
| Range | $62,235 | $76,806 |
| Mean | $51,986 | $50,471 |
| Median | $51,771 | $50,313 |
| Interquartile 25% (IQ1) | $42,565 | $44,258 |
| Interquartile 75% (IQ3) | $60,681 | $56,532 |
| Interquartile Range (IQR) | $18,116 | $12,274 |
| Standard Deviation (Sample) | $14,250 | $13,962 |
| Standard Deviation (Population) | $14,142 | $13,755 |
Similar Demographics by Householder Income Over 65 years
Demographics Similar to U.S. Virgin Islanders by Householder Income Over 65 years
In terms of householder income over 65 years, the demographic groups most similar to U.S. Virgin Islanders are Immigrants from Nicaragua ($52,085, a difference of 0.020%), Native/Alaskan ($52,081, a difference of 0.020%), Immigrants from the Azores ($52,121, a difference of 0.090%), Creek ($51,949, a difference of 0.24%), and Immigrants from St. Vincent and the Grenadines ($51,922, a difference of 0.29%).
| Demographics | Rating | Rank | Householder Income Over 65 years |
| Immigrants | Mexico | 0.0 /100 | #308 | Tragic $52,801 |
| Hondurans | 0.0 /100 | #309 | Tragic $52,634 |
| Sioux | 0.0 /100 | #310 | Tragic $52,509 |
| Seminole | 0.0 /100 | #311 | Tragic $52,373 |
| Immigrants | Azores | 0.0 /100 | #312 | Tragic $52,121 |
| Immigrants | Nicaragua | 0.0 /100 | #313 | Tragic $52,085 |
| Natives/Alaskans | 0.0 /100 | #314 | Tragic $52,081 |
| U.S. Virgin Islanders | 0.0 /100 | #315 | Tragic $52,072 |
| Creek | 0.0 /100 | #316 | Tragic $51,949 |
| Immigrants | St. Vincent and the Grenadines | 0.0 /100 | #317 | Tragic $51,922 |
| Haitians | 0.0 /100 | #318 | Tragic $51,912 |
| Immigrants | Honduras | 0.0 /100 | #319 | Tragic $51,888 |
| Colville | 0.0 /100 | #320 | Tragic $51,739 |
| Menominee | 0.0 /100 | #321 | Tragic $51,719 |
| British West Indians | 0.0 /100 | #322 | Tragic $51,463 |
Demographics Similar to French American Indians by Householder Income Over 65 years
In terms of householder income over 65 years, the demographic groups most similar to French American Indians are Bangladeshi ($54,719, a difference of 0.040%), Apache ($54,668, a difference of 0.060%), Belizean ($54,580, a difference of 0.22%), Jamaican ($54,560, a difference of 0.25%), and Guatemalan ($54,526, a difference of 0.32%).
| Demographics | Rating | Rank | Householder Income Over 65 years |
| German Russians | 0.3 /100 | #256 | Tragic $55,356 |
| Trinidadians and Tobagonians | 0.3 /100 | #257 | Tragic $55,327 |
| Ecuadorians | 0.2 /100 | #258 | Tragic $54,958 |
| West Indians | 0.2 /100 | #259 | Tragic $54,936 |
| Immigrants | West Indies | 0.2 /100 | #260 | Tragic $54,927 |
| Comanche | 0.2 /100 | #261 | Tragic $54,922 |
| Bangladeshis | 0.1 /100 | #262 | Tragic $54,719 |
| French American Indians | 0.1 /100 | #263 | Tragic $54,699 |
| Apache | 0.1 /100 | #264 | Tragic $54,668 |
| Belizeans | 0.1 /100 | #265 | Tragic $54,580 |
| Jamaicans | 0.1 /100 | #266 | Tragic $54,560 |
| Guatemalans | 0.1 /100 | #267 | Tragic $54,526 |
| Immigrants | Zaire | 0.1 /100 | #268 | Tragic $54,512 |
| Nicaraguans | 0.1 /100 | #269 | Tragic $54,474 |
| Immigrants | Senegal | 0.1 /100 | #270 | Tragic $54,447 |