Immigrants from Venezuela vs French American Indian Householder Income Under 25 years
COMPARE
Immigrants from Venezuela
French American Indian
Householder Income Under 25 years
Householder Income Under 25 years Comparison
Immigrants from Venezuela
French American Indians
$50,109
HOUSEHOLDER INCOME UNDER 25 YEARS
0.6/ 100
METRIC RATING
266th/ 347
METRIC RANK
$48,977
HOUSEHOLDER INCOME UNDER 25 YEARS
0.0/ 100
METRIC RATING
286th/ 347
METRIC RANK
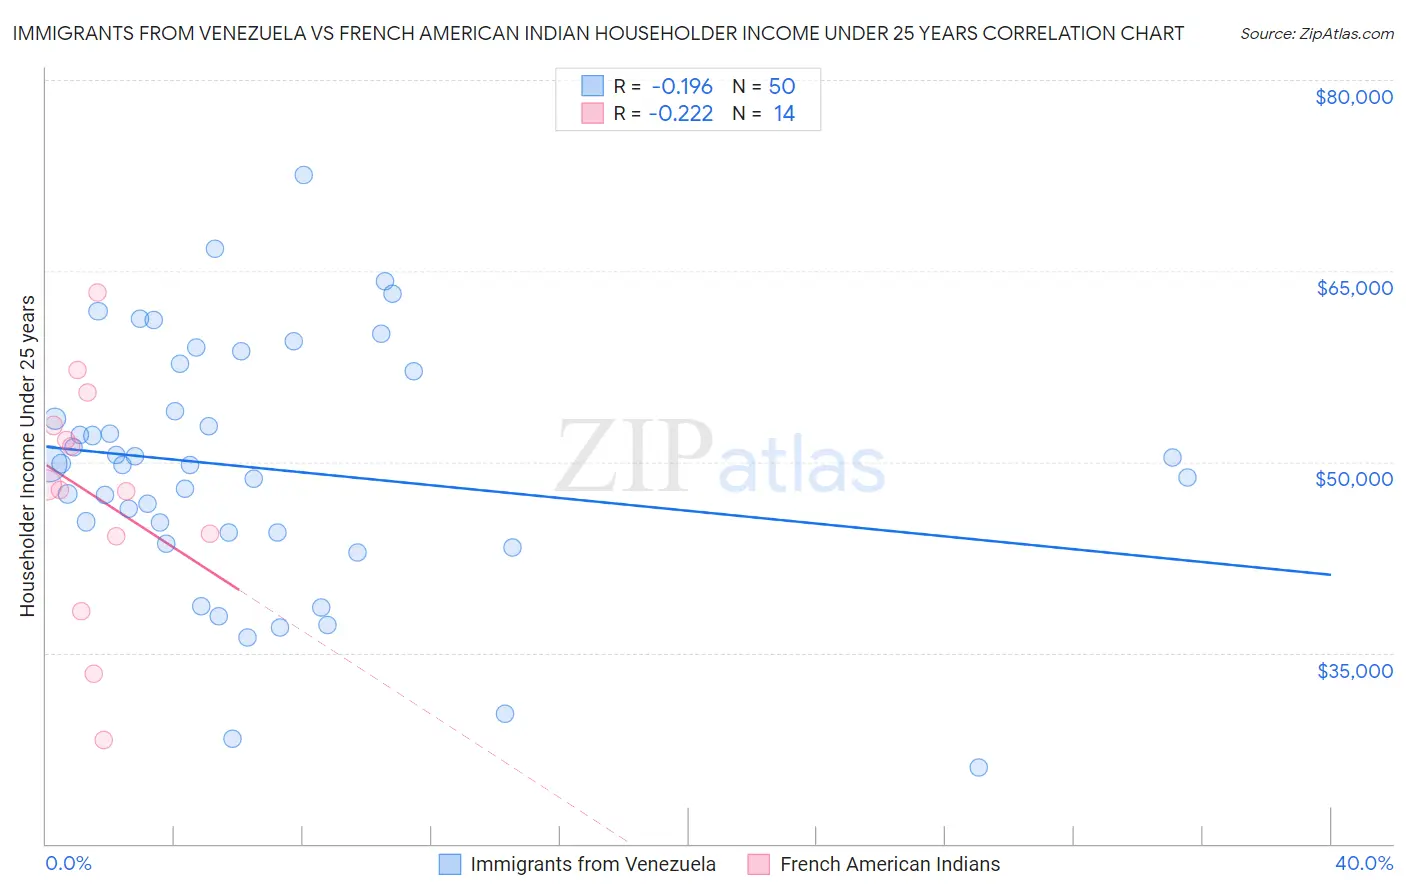
Immigrants from Venezuela vs French American Indian Householder Income Under 25 years Correlation Chart
The statistical analysis conducted on geographies consisting of 252,886,883 people shows a poor negative correlation between the proportion of Immigrants from Venezuela and household income with householder under the age of 25 in the United States with a correlation coefficient (R) of -0.196 and weighted average of $50,109. Similarly, the statistical analysis conducted on geographies consisting of 121,781,393 people shows a weak negative correlation between the proportion of French American Indians and household income with householder under the age of 25 in the United States with a correlation coefficient (R) of -0.222 and weighted average of $48,977, a difference of 2.3%.
Householder Income Under 25 years Correlation Summary
| Measurement | Immigrants from Venezuela | French American Indian |
| Minimum | $26,011 | $28,139 |
| Maximum | $72,500 | $63,296 |
| Range | $46,489 | $35,157 |
| Mean | $49,474 | $47,414 |
| Median | $49,840 | $47,997 |
| Interquartile 25% (IQ1) | $44,436 | $44,202 |
| Interquartile 75% (IQ3) | $57,134 | $52,866 |
| Interquartile Range (IQR) | $12,698 | $8,663 |
| Standard Deviation (Sample) | $9,803 | $9,404 |
| Standard Deviation (Population) | $9,705 | $9,062 |
Demographics Similar to Immigrants from Venezuela and French American Indians by Householder Income Under 25 years
In terms of householder income under 25 years, the demographic groups most similar to Immigrants from Venezuela are Immigrants from Laos ($50,041, a difference of 0.14%), Venezuelan ($50,011, a difference of 0.19%), Ute ($49,997, a difference of 0.22%), Mexican ($49,989, a difference of 0.24%), and Taiwanese ($49,804, a difference of 0.61%). Similarly, the demographic groups most similar to French American Indians are Scotch-Irish ($49,039, a difference of 0.13%), Carpatho Rusyn ($49,113, a difference of 0.28%), Immigrants from Nigeria ($49,174, a difference of 0.40%), Alsatian ($49,267, a difference of 0.59%), and Nonimmigrants ($49,348, a difference of 0.76%).
| Demographics | Rating | Rank | Householder Income Under 25 years |
| Immigrants | Venezuela | 0.6 /100 | #266 | Tragic $50,109 |
| Immigrants | Laos | 0.5 /100 | #267 | Tragic $50,041 |
| Venezuelans | 0.5 /100 | #268 | Tragic $50,011 |
| Ute | 0.5 /100 | #269 | Tragic $49,997 |
| Mexicans | 0.5 /100 | #270 | Tragic $49,989 |
| Taiwanese | 0.3 /100 | #271 | Tragic $49,804 |
| Colville | 0.3 /100 | #272 | Tragic $49,774 |
| Slovaks | 0.3 /100 | #273 | Tragic $49,753 |
| Immigrants | Senegal | 0.3 /100 | #274 | Tragic $49,742 |
| Immigrants | Kenya | 0.2 /100 | #275 | Tragic $49,633 |
| Dominicans | 0.2 /100 | #276 | Tragic $49,633 |
| Immigrants | Western Africa | 0.2 /100 | #277 | Tragic $49,621 |
| Nigerians | 0.1 /100 | #278 | Tragic $49,416 |
| Apache | 0.1 /100 | #279 | Tragic $49,395 |
| Hmong | 0.1 /100 | #280 | Tragic $49,364 |
| Immigrants | Nonimmigrants | 0.1 /100 | #281 | Tragic $49,348 |
| Alsatians | 0.1 /100 | #282 | Tragic $49,267 |
| Immigrants | Nigeria | 0.1 /100 | #283 | Tragic $49,174 |
| Carpatho Rusyns | 0.1 /100 | #284 | Tragic $49,113 |
| Scotch-Irish | 0.0 /100 | #285 | Tragic $49,039 |
| French American Indians | 0.0 /100 | #286 | Tragic $48,977 |