Immigrants from Venezuela vs French American Indian Single Father Poverty
COMPARE
Immigrants from Venezuela
French American Indian
Single Father Poverty
Single Father Poverty Comparison
Immigrants from Venezuela
French American Indians
16.4%
SINGLE FATHER POVERTY
31.0/ 100
METRIC RATING
186th/ 347
METRIC RANK
17.4%
SINGLE FATHER POVERTY
0.2/ 100
METRIC RATING
271st/ 347
METRIC RANK
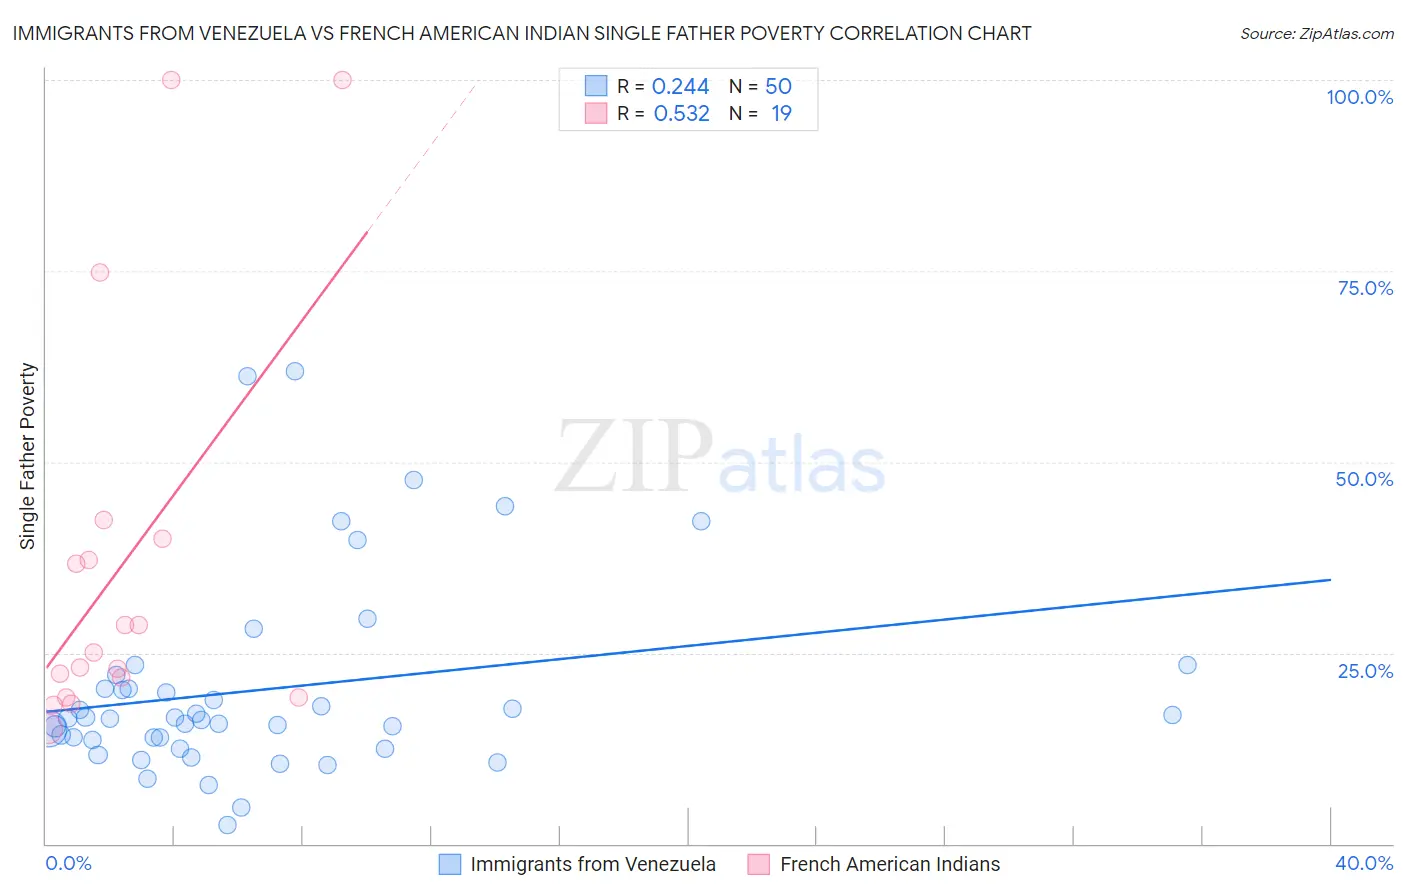
Immigrants from Venezuela vs French American Indian Single Father Poverty Correlation Chart
The statistical analysis conducted on geographies consisting of 236,867,266 people shows a weak positive correlation between the proportion of Immigrants from Venezuela and poverty level among single fathers in the United States with a correlation coefficient (R) of 0.244 and weighted average of 16.4%. Similarly, the statistical analysis conducted on geographies consisting of 117,658,410 people shows a substantial positive correlation between the proportion of French American Indians and poverty level among single fathers in the United States with a correlation coefficient (R) of 0.532 and weighted average of 17.4%, a difference of 6.1%.
Single Father Poverty Correlation Summary
| Measurement | Immigrants from Venezuela | French American Indian |
| Minimum | 2.4% | 15.1% |
| Maximum | 61.9% | 100.0% |
| Range | 59.5% | 84.9% |
| Mean | 20.2% | 36.5% |
| Median | 16.4% | 25.0% |
| Interquartile 25% (IQ1) | 13.6% | 19.2% |
| Interquartile 75% (IQ3) | 20.3% | 40.0% |
| Interquartile Range (IQR) | 6.7% | 20.8% |
| Standard Deviation (Sample) | 12.9% | 26.2% |
| Standard Deviation (Population) | 12.8% | 25.5% |
Similar Demographics by Single Father Poverty
Demographics Similar to Immigrants from Venezuela by Single Father Poverty
In terms of single father poverty, the demographic groups most similar to Immigrants from Venezuela are Ukrainian (16.4%, a difference of 0.030%), Russian (16.4%, a difference of 0.050%), Latvian (16.5%, a difference of 0.11%), Panamanian (16.4%, a difference of 0.13%), and Immigrants from Burma/Myanmar (16.5%, a difference of 0.16%).
| Demographics | Rating | Rank | Single Father Poverty |
| Serbians | 40.9 /100 | #179 | Average 16.4% |
| Immigrants | Latin America | 37.2 /100 | #180 | Fair 16.4% |
| Immigrants | Western Africa | 36.0 /100 | #181 | Fair 16.4% |
| Immigrants | Italy | 35.7 /100 | #182 | Fair 16.4% |
| Aleuts | 35.3 /100 | #183 | Fair 16.4% |
| Cambodians | 34.6 /100 | #184 | Fair 16.4% |
| Panamanians | 33.6 /100 | #185 | Fair 16.4% |
| Immigrants | Venezuela | 31.0 /100 | #186 | Fair 16.4% |
| Ukrainians | 30.4 /100 | #187 | Fair 16.4% |
| Russians | 30.1 /100 | #188 | Fair 16.4% |
| Latvians | 28.9 /100 | #189 | Fair 16.5% |
| Immigrants | Burma/Myanmar | 28.0 /100 | #190 | Fair 16.5% |
| Immigrants | Guyana | 27.1 /100 | #191 | Fair 16.5% |
| Immigrants | Switzerland | 24.8 /100 | #192 | Fair 16.5% |
| Ecuadorians | 24.5 /100 | #193 | Fair 16.5% |
Demographics Similar to French American Indians by Single Father Poverty
In terms of single father poverty, the demographic groups most similar to French American Indians are Indonesian (17.4%, a difference of 0.14%), Barbadian (17.5%, a difference of 0.35%), Slavic (17.4%, a difference of 0.40%), Immigrants from Caribbean (17.4%, a difference of 0.47%), and Haitian (17.3%, a difference of 0.57%).
| Demographics | Rating | Rank | Single Father Poverty |
| Slovenes | 0.3 /100 | #264 | Tragic 17.3% |
| Poles | 0.3 /100 | #265 | Tragic 17.3% |
| Jamaicans | 0.3 /100 | #266 | Tragic 17.3% |
| Haitians | 0.3 /100 | #267 | Tragic 17.3% |
| Immigrants | Caribbean | 0.3 /100 | #268 | Tragic 17.4% |
| Slavs | 0.3 /100 | #269 | Tragic 17.4% |
| Indonesians | 0.2 /100 | #270 | Tragic 17.4% |
| French American Indians | 0.2 /100 | #271 | Tragic 17.4% |
| Barbadians | 0.1 /100 | #272 | Tragic 17.5% |
| Italians | 0.1 /100 | #273 | Tragic 17.5% |
| Macedonians | 0.1 /100 | #274 | Tragic 17.7% |
| British West Indians | 0.0 /100 | #275 | Tragic 17.7% |
| German Russians | 0.0 /100 | #276 | Tragic 17.7% |
| Lebanese | 0.0 /100 | #277 | Tragic 17.7% |
| Germans | 0.0 /100 | #278 | Tragic 17.7% |