Immigrants from Germany vs French American Indian Householder Income Over 65 years
COMPARE
Immigrants from Germany
French American Indian
Householder Income Over 65 years
Householder Income Over 65 years Comparison
Immigrants from Germany
French American Indians
$62,544
HOUSEHOLDER INCOME OVER 65 YEARS
83.9/ 100
METRIC RATING
132nd/ 347
METRIC RANK
$54,699
HOUSEHOLDER INCOME OVER 65 YEARS
0.1/ 100
METRIC RATING
263rd/ 347
METRIC RANK
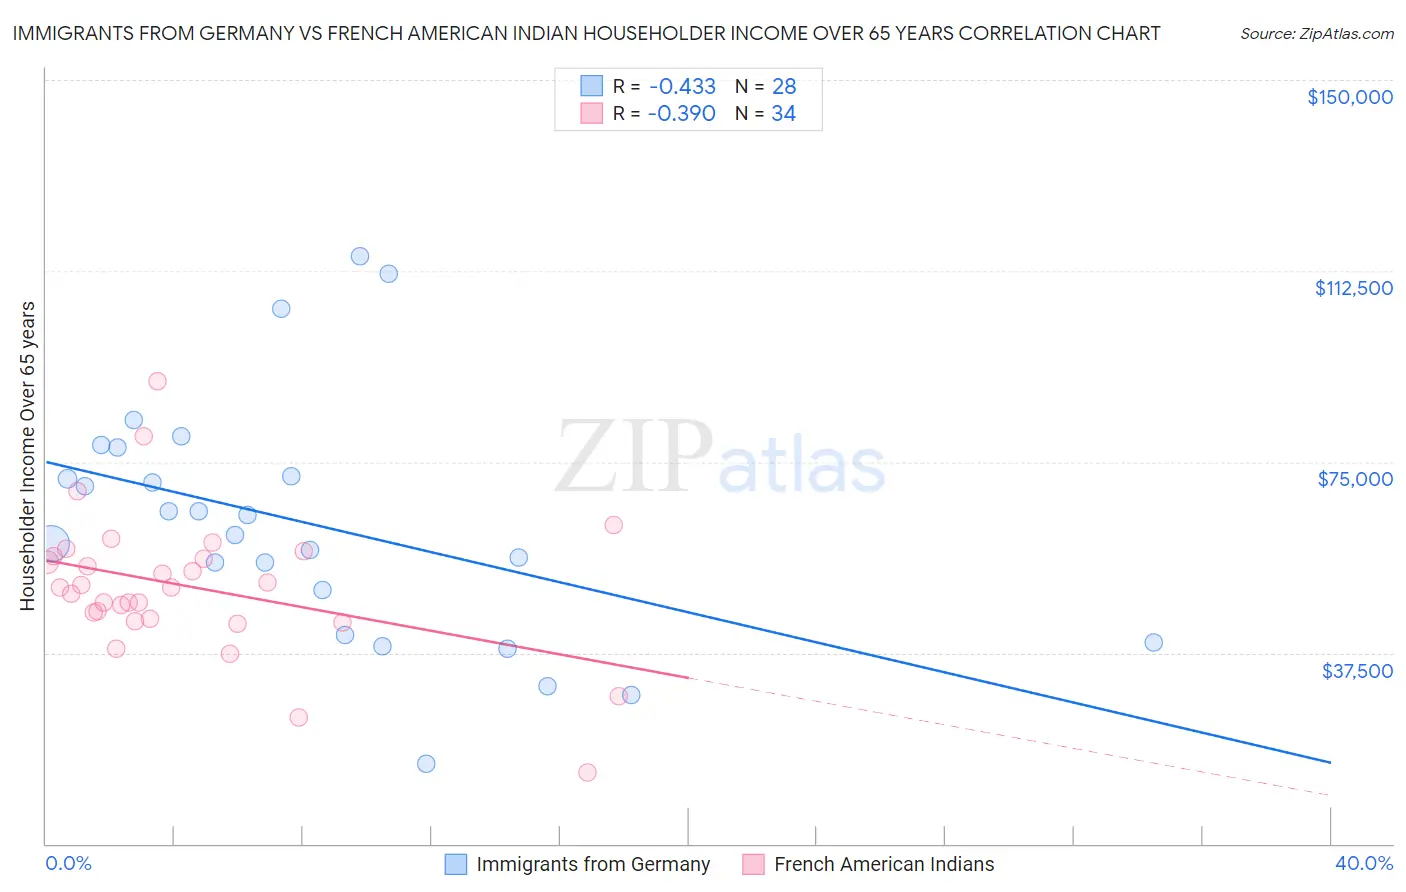
Immigrants from Germany vs French American Indian Householder Income Over 65 years Correlation Chart
The statistical analysis conducted on geographies consisting of 462,250,786 people shows a moderate negative correlation between the proportion of Immigrants from Germany and household income with householder over the age of 65 in the United States with a correlation coefficient (R) of -0.433 and weighted average of $62,544. Similarly, the statistical analysis conducted on geographies consisting of 131,860,683 people shows a mild negative correlation between the proportion of French American Indians and household income with householder over the age of 65 in the United States with a correlation coefficient (R) of -0.390 and weighted average of $54,699, a difference of 14.3%.
Householder Income Over 65 years Correlation Summary
| Measurement | Immigrants from Germany | French American Indian |
| Minimum | $15,625 | $13,958 |
| Maximum | $115,357 | $90,764 |
| Range | $99,732 | $76,806 |
| Mean | $62,831 | $50,471 |
| Median | $62,572 | $50,313 |
| Interquartile 25% (IQ1) | $45,444 | $44,258 |
| Interquartile 75% (IQ3) | $74,989 | $56,532 |
| Interquartile Range (IQR) | $29,545 | $12,274 |
| Standard Deviation (Sample) | $23,868 | $13,962 |
| Standard Deviation (Population) | $23,438 | $13,755 |
Similar Demographics by Householder Income Over 65 years
Demographics Similar to Immigrants from Germany by Householder Income Over 65 years
In terms of householder income over 65 years, the demographic groups most similar to Immigrants from Germany are Immigrants from Northern Africa ($62,522, a difference of 0.040%), Immigrants from Western Asia ($62,645, a difference of 0.16%), Basque ($62,653, a difference of 0.17%), Immigrants from Eastern Europe ($62,693, a difference of 0.24%), and Aleut ($62,708, a difference of 0.26%).
| Demographics | Rating | Rank | Householder Income Over 65 years |
| Soviet Union | 87.8 /100 | #125 | Excellent $62,848 |
| Peruvians | 86.8 /100 | #126 | Excellent $62,766 |
| Swedes | 86.4 /100 | #127 | Excellent $62,736 |
| Aleuts | 86.1 /100 | #128 | Excellent $62,708 |
| Immigrants | Eastern Europe | 85.9 /100 | #129 | Excellent $62,693 |
| Basques | 85.4 /100 | #130 | Excellent $62,653 |
| Immigrants | Western Asia | 85.3 /100 | #131 | Excellent $62,645 |
| Immigrants | Germany | 83.9 /100 | #132 | Excellent $62,544 |
| Immigrants | Northern Africa | 83.6 /100 | #133 | Excellent $62,522 |
| Immigrants | Brazil | 81.2 /100 | #134 | Excellent $62,364 |
| Immigrants | Chile | 81.0 /100 | #135 | Excellent $62,354 |
| Alaskan Athabascans | 80.6 /100 | #136 | Excellent $62,330 |
| Immigrants | Syria | 80.2 /100 | #137 | Excellent $62,303 |
| Immigrants | Kazakhstan | 80.0 /100 | #138 | Excellent $62,292 |
| Lebanese | 79.9 /100 | #139 | Good $62,287 |
Demographics Similar to French American Indians by Householder Income Over 65 years
In terms of householder income over 65 years, the demographic groups most similar to French American Indians are Bangladeshi ($54,719, a difference of 0.040%), Apache ($54,668, a difference of 0.060%), Belizean ($54,580, a difference of 0.22%), Jamaican ($54,560, a difference of 0.25%), and Guatemalan ($54,526, a difference of 0.32%).
| Demographics | Rating | Rank | Householder Income Over 65 years |
| German Russians | 0.3 /100 | #256 | Tragic $55,356 |
| Trinidadians and Tobagonians | 0.3 /100 | #257 | Tragic $55,327 |
| Ecuadorians | 0.2 /100 | #258 | Tragic $54,958 |
| West Indians | 0.2 /100 | #259 | Tragic $54,936 |
| Immigrants | West Indies | 0.2 /100 | #260 | Tragic $54,927 |
| Comanche | 0.2 /100 | #261 | Tragic $54,922 |
| Bangladeshis | 0.1 /100 | #262 | Tragic $54,719 |
| French American Indians | 0.1 /100 | #263 | Tragic $54,699 |
| Apache | 0.1 /100 | #264 | Tragic $54,668 |
| Belizeans | 0.1 /100 | #265 | Tragic $54,580 |
| Jamaicans | 0.1 /100 | #266 | Tragic $54,560 |
| Guatemalans | 0.1 /100 | #267 | Tragic $54,526 |
| Immigrants | Zaire | 0.1 /100 | #268 | Tragic $54,512 |
| Nicaraguans | 0.1 /100 | #269 | Tragic $54,474 |
| Immigrants | Senegal | 0.1 /100 | #270 | Tragic $54,447 |