Spaniard vs French American Indian Householder Income Over 65 years
COMPARE
Spaniard
French American Indian
Householder Income Over 65 years
Householder Income Over 65 years Comparison
Spaniards
French American Indians
$60,866
HOUSEHOLDER INCOME OVER 65 YEARS
47.3/ 100
METRIC RATING
175th/ 347
METRIC RANK
$54,699
HOUSEHOLDER INCOME OVER 65 YEARS
0.1/ 100
METRIC RATING
263rd/ 347
METRIC RANK
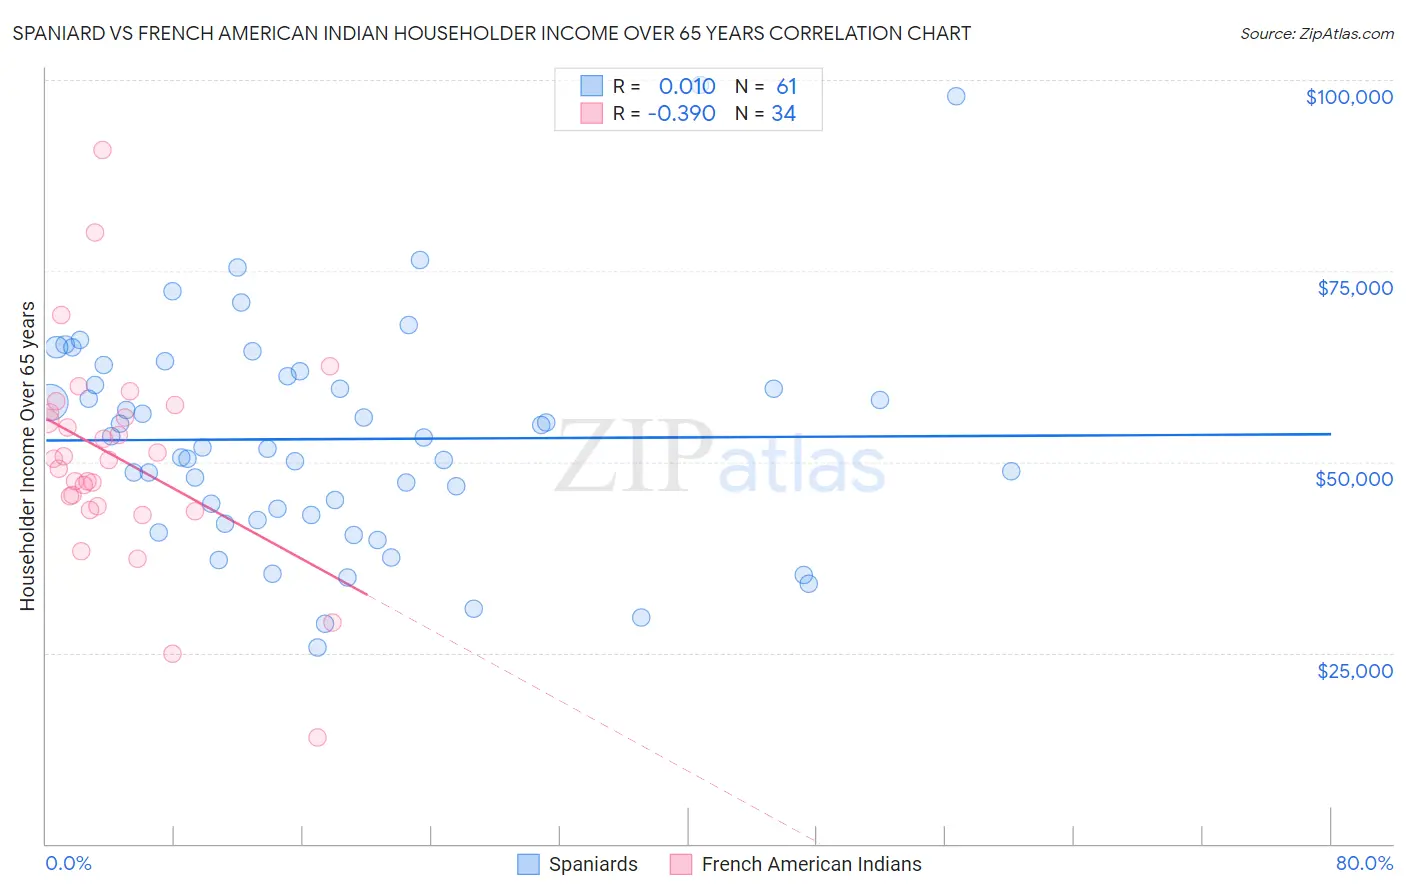
Spaniard vs French American Indian Householder Income Over 65 years Correlation Chart
The statistical analysis conducted on geographies consisting of 441,402,444 people shows no correlation between the proportion of Spaniards and household income with householder over the age of 65 in the United States with a correlation coefficient (R) of 0.010 and weighted average of $60,866. Similarly, the statistical analysis conducted on geographies consisting of 131,860,683 people shows a mild negative correlation between the proportion of French American Indians and household income with householder over the age of 65 in the United States with a correlation coefficient (R) of -0.390 and weighted average of $54,699, a difference of 11.3%.
Householder Income Over 65 years Correlation Summary
| Measurement | Spaniard | French American Indian |
| Minimum | $25,625 | $13,958 |
| Maximum | $99,316 | $90,764 |
| Range | $73,691 | $76,806 |
| Mean | $52,982 | $50,471 |
| Median | $51,848 | $50,313 |
| Interquartile 25% (IQ1) | $42,711 | $44,258 |
| Interquartile 75% (IQ3) | $61,532 | $56,532 |
| Interquartile Range (IQR) | $18,821 | $12,274 |
| Standard Deviation (Sample) | $14,647 | $13,962 |
| Standard Deviation (Population) | $14,526 | $13,755 |
Similar Demographics by Householder Income Over 65 years
Demographics Similar to Spaniards by Householder Income Over 65 years
In terms of householder income over 65 years, the demographic groups most similar to Spaniards are Spanish ($60,795, a difference of 0.12%), Luxembourger ($60,967, a difference of 0.17%), Alaska Native ($60,748, a difference of 0.19%), Immigrants from Micronesia ($61,000, a difference of 0.22%), and Yup'ik ($60,727, a difference of 0.23%).
| Demographics | Rating | Rank | Householder Income Over 65 years |
| Irish | 53.4 /100 | #168 | Average $61,097 |
| Carpatho Rusyns | 53.3 /100 | #169 | Average $61,093 |
| Serbians | 53.1 /100 | #170 | Average $61,087 |
| Inupiat | 52.4 /100 | #171 | Average $61,061 |
| Immigrants | Poland | 51.9 /100 | #172 | Average $61,041 |
| Immigrants | Micronesia | 50.8 /100 | #173 | Average $61,000 |
| Luxembourgers | 50.0 /100 | #174 | Average $60,967 |
| Spaniards | 47.3 /100 | #175 | Average $60,866 |
| Spanish | 45.5 /100 | #176 | Average $60,795 |
| Alaska Natives | 44.3 /100 | #177 | Average $60,748 |
| Yup'ik | 43.7 /100 | #178 | Average $60,727 |
| Welsh | 42.2 /100 | #179 | Average $60,666 |
| Immigrants | Morocco | 41.7 /100 | #180 | Average $60,647 |
| Celtics | 40.7 /100 | #181 | Average $60,608 |
| Czechoslovakians | 40.0 /100 | #182 | Average $60,581 |
Demographics Similar to French American Indians by Householder Income Over 65 years
In terms of householder income over 65 years, the demographic groups most similar to French American Indians are Bangladeshi ($54,719, a difference of 0.040%), Apache ($54,668, a difference of 0.060%), Belizean ($54,580, a difference of 0.22%), Jamaican ($54,560, a difference of 0.25%), and Guatemalan ($54,526, a difference of 0.32%).
| Demographics | Rating | Rank | Householder Income Over 65 years |
| German Russians | 0.3 /100 | #256 | Tragic $55,356 |
| Trinidadians and Tobagonians | 0.3 /100 | #257 | Tragic $55,327 |
| Ecuadorians | 0.2 /100 | #258 | Tragic $54,958 |
| West Indians | 0.2 /100 | #259 | Tragic $54,936 |
| Immigrants | West Indies | 0.2 /100 | #260 | Tragic $54,927 |
| Comanche | 0.2 /100 | #261 | Tragic $54,922 |
| Bangladeshis | 0.1 /100 | #262 | Tragic $54,719 |
| French American Indians | 0.1 /100 | #263 | Tragic $54,699 |
| Apache | 0.1 /100 | #264 | Tragic $54,668 |
| Belizeans | 0.1 /100 | #265 | Tragic $54,580 |
| Jamaicans | 0.1 /100 | #266 | Tragic $54,560 |
| Guatemalans | 0.1 /100 | #267 | Tragic $54,526 |
| Immigrants | Zaire | 0.1 /100 | #268 | Tragic $54,512 |
| Nicaraguans | 0.1 /100 | #269 | Tragic $54,474 |
| Immigrants | Senegal | 0.1 /100 | #270 | Tragic $54,447 |