Ottawa vs Turkish Householder Income Ages 45 - 64 years
COMPARE
Ottawa
Turkish
Householder Income Ages 45 - 64 years
Householder Income Ages 45 - 64 years Comparison
Ottawa
Turks
$83,953
HOUSEHOLDER INCOME AGES 45 - 64 YEARS
0.0/ 100
METRIC RATING
304th/ 347
METRIC RANK
$117,814
HOUSEHOLDER INCOME AGES 45 - 64 YEARS
100.0/ 100
METRIC RATING
28th/ 347
METRIC RANK
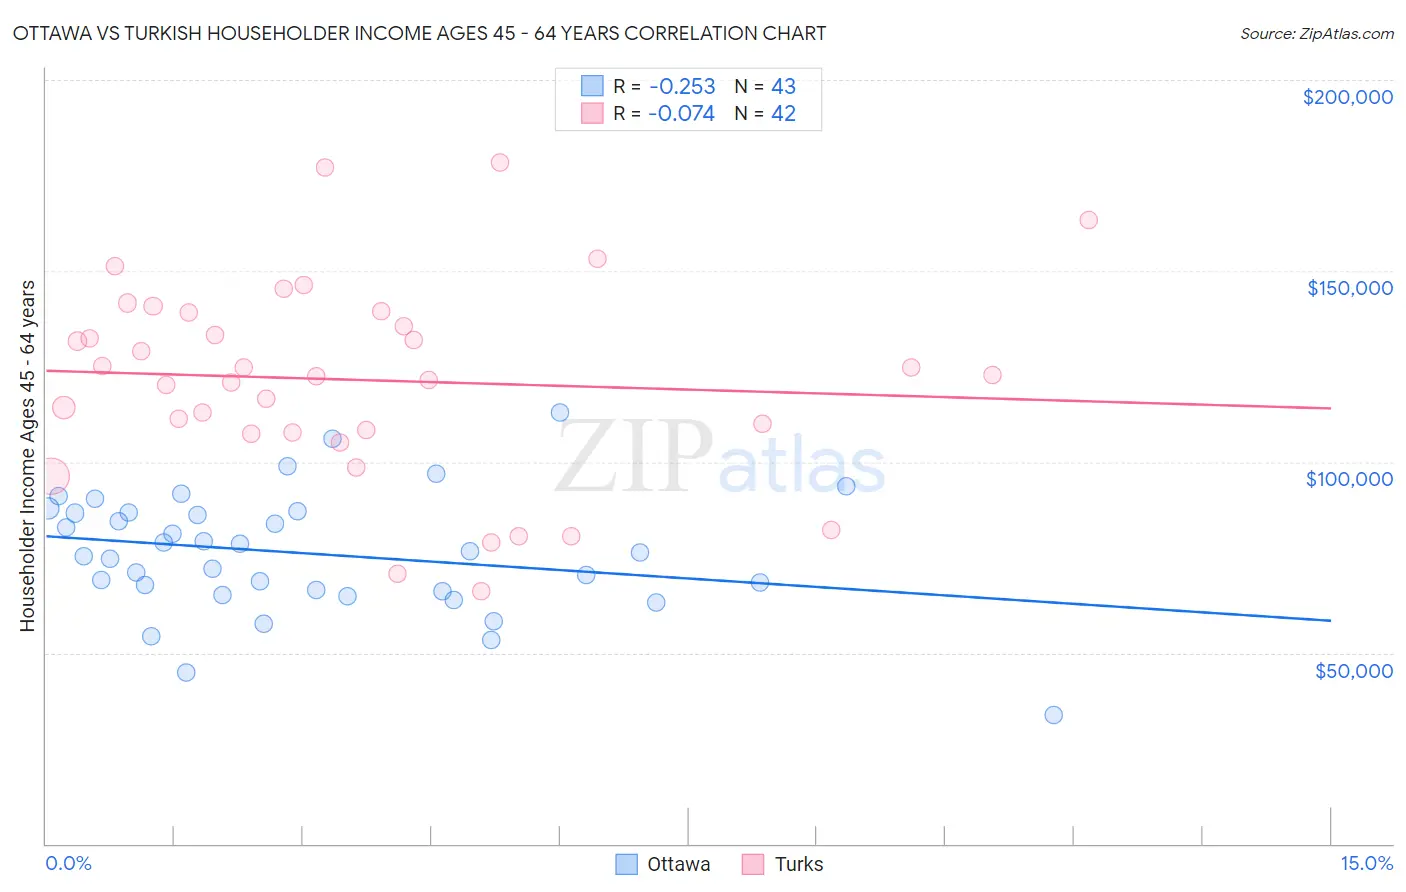
Ottawa vs Turkish Householder Income Ages 45 - 64 years Correlation Chart
The statistical analysis conducted on geographies consisting of 49,895,543 people shows a weak negative correlation between the proportion of Ottawa and household income with householder between the ages 45 and 64 in the United States with a correlation coefficient (R) of -0.253 and weighted average of $83,953. Similarly, the statistical analysis conducted on geographies consisting of 271,498,230 people shows a slight negative correlation between the proportion of Turks and household income with householder between the ages 45 and 64 in the United States with a correlation coefficient (R) of -0.074 and weighted average of $117,814, a difference of 40.3%.
Householder Income Ages 45 - 64 years Correlation Summary
| Measurement | Ottawa | Turkish |
| Minimum | $33,750 | $66,250 |
| Maximum | $112,917 | $178,523 |
| Range | $79,167 | $112,273 |
| Mean | $75,969 | $121,410 |
| Median | $76,250 | $122,614 |
| Interquartile 25% (IQ1) | $66,250 | $107,799 |
| Interquartile 75% (IQ3) | $86,776 | $139,122 |
| Interquartile Range (IQR) | $20,526 | $31,324 |
| Standard Deviation (Sample) | $15,805 | $26,168 |
| Standard Deviation (Population) | $15,620 | $25,855 |
Similar Demographics by Householder Income Ages 45 - 64 years
Demographics Similar to Ottawa by Householder Income Ages 45 - 64 years
In terms of householder income ages 45 - 64 years, the demographic groups most similar to Ottawa are Chippewa ($83,943, a difference of 0.010%), Ute ($83,937, a difference of 0.020%), Honduran ($84,079, a difference of 0.15%), Shoshone ($83,588, a difference of 0.44%), and Immigrants from Cabo Verde ($83,542, a difference of 0.49%).
| Demographics | Rating | Rank | Householder Income Ages 45 - 64 years |
| Fijians | 0.1 /100 | #297 | Tragic $85,187 |
| Africans | 0.0 /100 | #298 | Tragic $84,925 |
| Immigrants | Mexico | 0.0 /100 | #299 | Tragic $84,910 |
| Indonesians | 0.0 /100 | #300 | Tragic $84,890 |
| Potawatomi | 0.0 /100 | #301 | Tragic $84,613 |
| Haitians | 0.0 /100 | #302 | Tragic $84,384 |
| Hondurans | 0.0 /100 | #303 | Tragic $84,079 |
| Ottawa | 0.0 /100 | #304 | Tragic $83,953 |
| Chippewa | 0.0 /100 | #305 | Tragic $83,943 |
| Ute | 0.0 /100 | #306 | Tragic $83,937 |
| Shoshone | 0.0 /100 | #307 | Tragic $83,588 |
| Immigrants | Cabo Verde | 0.0 /100 | #308 | Tragic $83,542 |
| Immigrants | Dominica | 0.0 /100 | #309 | Tragic $83,311 |
| Immigrants | Haiti | 0.0 /100 | #310 | Tragic $83,257 |
| Immigrants | Bahamas | 0.0 /100 | #311 | Tragic $83,177 |
Demographics Similar to Turks by Householder Income Ages 45 - 64 years
In terms of householder income ages 45 - 64 years, the demographic groups most similar to Turks are Bhutanese ($117,750, a difference of 0.050%), Immigrants from Bolivia ($117,731, a difference of 0.070%), Immigrants from Northern Europe ($117,930, a difference of 0.10%), Immigrants from Sweden ($118,318, a difference of 0.43%), and Asian ($118,426, a difference of 0.52%).
| Demographics | Rating | Rank | Householder Income Ages 45 - 64 years |
| Immigrants | Sri Lanka | 100.0 /100 | #21 | Exceptional $119,094 |
| Immigrants | Belgium | 100.0 /100 | #22 | Exceptional $118,932 |
| Bolivians | 100.0 /100 | #23 | Exceptional $118,871 |
| Immigrants | Japan | 100.0 /100 | #24 | Exceptional $118,498 |
| Asians | 100.0 /100 | #25 | Exceptional $118,426 |
| Immigrants | Sweden | 100.0 /100 | #26 | Exceptional $118,318 |
| Immigrants | Northern Europe | 100.0 /100 | #27 | Exceptional $117,930 |
| Turks | 100.0 /100 | #28 | Exceptional $117,814 |
| Bhutanese | 100.0 /100 | #29 | Exceptional $117,750 |
| Immigrants | Bolivia | 100.0 /100 | #30 | Exceptional $117,731 |
| Immigrants | Asia | 100.0 /100 | #31 | Exceptional $116,566 |
| Russians | 100.0 /100 | #32 | Exceptional $116,328 |
| Chinese | 100.0 /100 | #33 | Exceptional $116,156 |
| Immigrants | Denmark | 100.0 /100 | #34 | Exceptional $116,000 |
| Latvians | 100.0 /100 | #35 | Exceptional $115,957 |