Nepalese vs Turkish Householder Income Ages 45 - 64 years
COMPARE
Nepalese
Turkish
Householder Income Ages 45 - 64 years
Householder Income Ages 45 - 64 years Comparison
Nepalese
Turks
$93,355
HOUSEHOLDER INCOME AGES 45 - 64 YEARS
3.0/ 100
METRIC RATING
233rd/ 347
METRIC RANK
$117,814
HOUSEHOLDER INCOME AGES 45 - 64 YEARS
100.0/ 100
METRIC RATING
28th/ 347
METRIC RANK
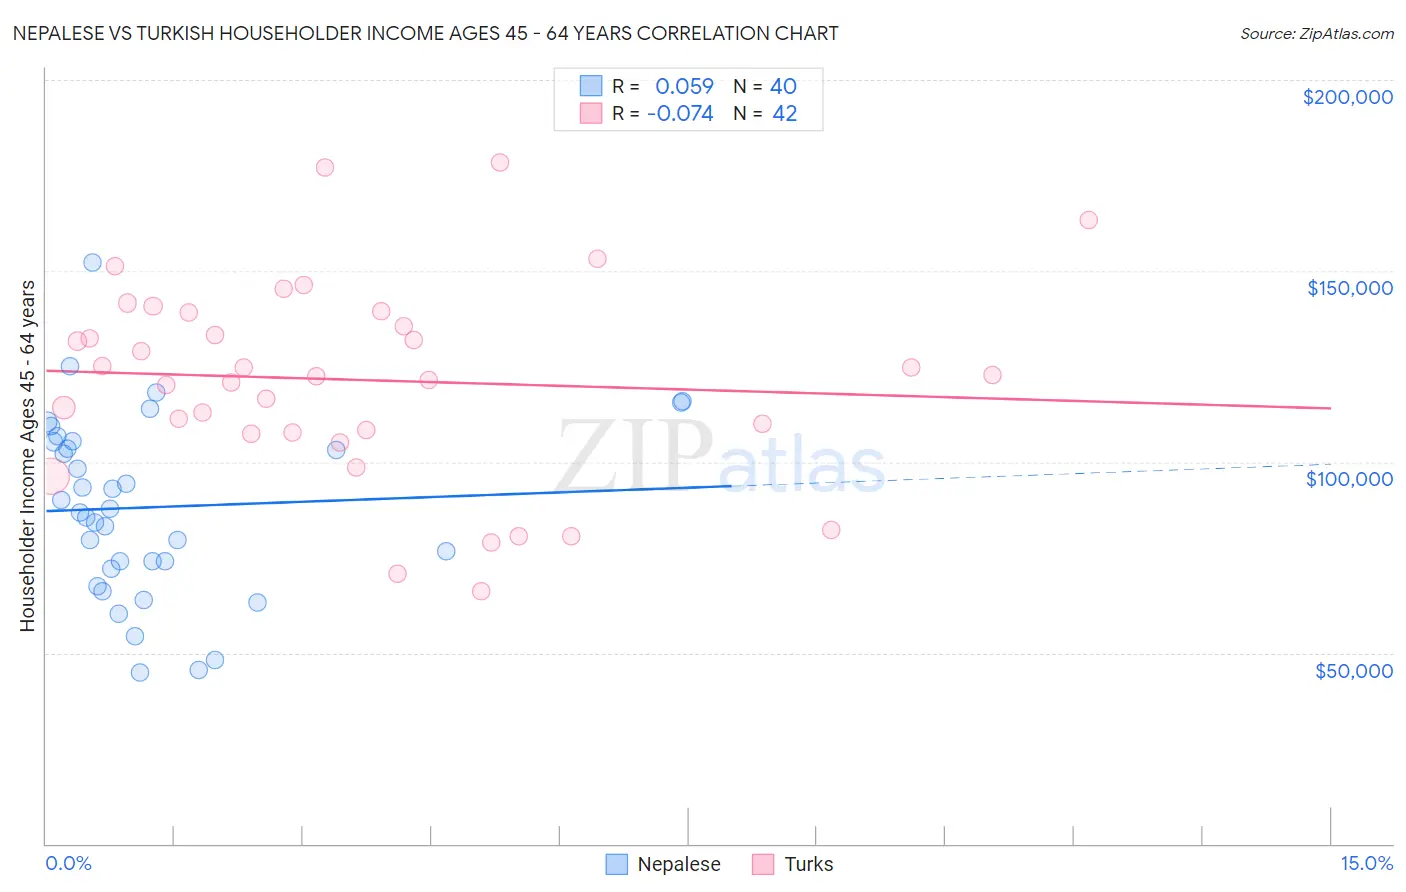
Nepalese vs Turkish Householder Income Ages 45 - 64 years Correlation Chart
The statistical analysis conducted on geographies consisting of 24,521,755 people shows a slight positive correlation between the proportion of Nepalese and household income with householder between the ages 45 and 64 in the United States with a correlation coefficient (R) of 0.059 and weighted average of $93,355. Similarly, the statistical analysis conducted on geographies consisting of 271,498,230 people shows a slight negative correlation between the proportion of Turks and household income with householder between the ages 45 and 64 in the United States with a correlation coefficient (R) of -0.074 and weighted average of $117,814, a difference of 26.2%.
Householder Income Ages 45 - 64 years Correlation Summary
| Measurement | Nepalese | Turkish |
| Minimum | $44,758 | $66,250 |
| Maximum | $152,367 | $178,523 |
| Range | $107,609 | $112,273 |
| Mean | $88,143 | $121,410 |
| Median | $87,241 | $122,614 |
| Interquartile 25% (IQ1) | $72,874 | $107,799 |
| Interquartile 75% (IQ3) | $105,294 | $139,122 |
| Interquartile Range (IQR) | $32,420 | $31,324 |
| Standard Deviation (Sample) | $23,682 | $26,168 |
| Standard Deviation (Population) | $23,385 | $25,855 |
Similar Demographics by Householder Income Ages 45 - 64 years
Demographics Similar to Nepalese by Householder Income Ages 45 - 64 years
In terms of householder income ages 45 - 64 years, the demographic groups most similar to Nepalese are Immigrants from El Salvador ($93,176, a difference of 0.19%), Sudanese ($93,718, a difference of 0.39%), Ecuadorian ($93,739, a difference of 0.41%), Vietnamese ($93,788, a difference of 0.46%), and Immigrants from Sudan ($93,781, a difference of 0.46%).
| Demographics | Rating | Rank | Householder Income Ages 45 - 64 years |
| Immigrants | Azores | 4.3 /100 | #226 | Tragic $94,138 |
| Alaska Natives | 4.0 /100 | #227 | Tragic $93,991 |
| Immigrants | Panama | 3.7 /100 | #228 | Tragic $93,815 |
| Vietnamese | 3.6 /100 | #229 | Tragic $93,788 |
| Immigrants | Sudan | 3.6 /100 | #230 | Tragic $93,781 |
| Ecuadorians | 3.6 /100 | #231 | Tragic $93,739 |
| Sudanese | 3.5 /100 | #232 | Tragic $93,718 |
| Nepalese | 3.0 /100 | #233 | Tragic $93,355 |
| Immigrants | El Salvador | 2.7 /100 | #234 | Tragic $93,176 |
| Nicaraguans | 2.0 /100 | #235 | Tragic $92,554 |
| Immigrants | Western Africa | 1.8 /100 | #236 | Tragic $92,384 |
| Immigrants | Bangladesh | 1.7 /100 | #237 | Tragic $92,208 |
| Pennsylvania Germans | 1.5 /100 | #238 | Tragic $91,956 |
| Immigrants | Ecuador | 1.2 /100 | #239 | Tragic $91,462 |
| Immigrants | Burma/Myanmar | 1.1 /100 | #240 | Tragic $91,385 |
Demographics Similar to Turks by Householder Income Ages 45 - 64 years
In terms of householder income ages 45 - 64 years, the demographic groups most similar to Turks are Bhutanese ($117,750, a difference of 0.050%), Immigrants from Bolivia ($117,731, a difference of 0.070%), Immigrants from Northern Europe ($117,930, a difference of 0.10%), Immigrants from Sweden ($118,318, a difference of 0.43%), and Asian ($118,426, a difference of 0.52%).
| Demographics | Rating | Rank | Householder Income Ages 45 - 64 years |
| Immigrants | Sri Lanka | 100.0 /100 | #21 | Exceptional $119,094 |
| Immigrants | Belgium | 100.0 /100 | #22 | Exceptional $118,932 |
| Bolivians | 100.0 /100 | #23 | Exceptional $118,871 |
| Immigrants | Japan | 100.0 /100 | #24 | Exceptional $118,498 |
| Asians | 100.0 /100 | #25 | Exceptional $118,426 |
| Immigrants | Sweden | 100.0 /100 | #26 | Exceptional $118,318 |
| Immigrants | Northern Europe | 100.0 /100 | #27 | Exceptional $117,930 |
| Turks | 100.0 /100 | #28 | Exceptional $117,814 |
| Bhutanese | 100.0 /100 | #29 | Exceptional $117,750 |
| Immigrants | Bolivia | 100.0 /100 | #30 | Exceptional $117,731 |
| Immigrants | Asia | 100.0 /100 | #31 | Exceptional $116,566 |
| Russians | 100.0 /100 | #32 | Exceptional $116,328 |
| Chinese | 100.0 /100 | #33 | Exceptional $116,156 |
| Immigrants | Denmark | 100.0 /100 | #34 | Exceptional $116,000 |
| Latvians | 100.0 /100 | #35 | Exceptional $115,957 |