Immigrants from Ireland vs Filipino Median Earnings
COMPARE
Immigrants from Ireland
Filipino
Median Earnings
Median Earnings Comparison
Immigrants from Ireland
Filipinos
$56,854
MEDIAN EARNINGS
100.0/ 100
METRIC RATING
12th/ 347
METRIC RANK
$61,197
MEDIAN EARNINGS
100.0/ 100
METRIC RATING
1st/ 347
METRIC RANK
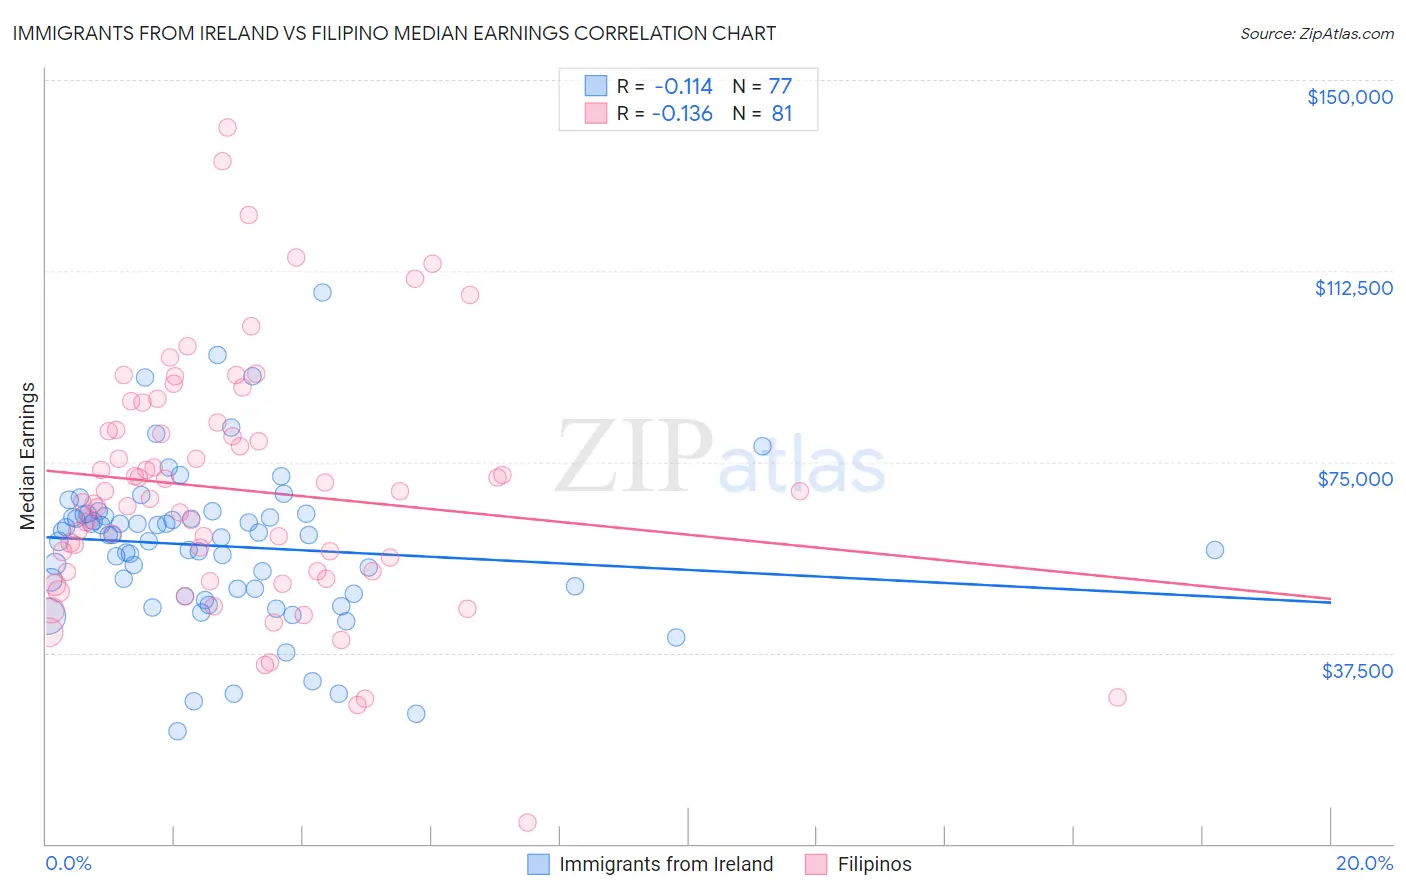
Immigrants from Ireland vs Filipino Median Earnings Correlation Chart
The statistical analysis conducted on geographies consisting of 240,768,964 people shows a poor negative correlation between the proportion of Immigrants from Ireland and median earnings in the United States with a correlation coefficient (R) of -0.114 and weighted average of $56,854. Similarly, the statistical analysis conducted on geographies consisting of 254,346,955 people shows a poor negative correlation between the proportion of Filipinos and median earnings in the United States with a correlation coefficient (R) of -0.136 and weighted average of $61,197, a difference of 7.6%.
Median Earnings Correlation Summary
| Measurement | Immigrants from Ireland | Filipino |
| Minimum | $22,198 | $4,235 |
| Maximum | $108,333 | $140,756 |
| Range | $86,135 | $136,521 |
| Mean | $58,485 | $69,566 |
| Median | $60,577 | $67,852 |
| Interquartile 25% (IQ1) | $49,600 | $53,487 |
| Interquartile 75% (IQ3) | $64,376 | $81,976 |
| Interquartile Range (IQR) | $14,776 | $28,490 |
| Standard Deviation (Sample) | $15,214 | $24,296 |
| Standard Deviation (Population) | $15,114 | $24,146 |
Demographics Similar to Immigrants from Ireland and Filipinos by Median Earnings
In terms of median earnings, the demographic groups most similar to Immigrants from Ireland are Immigrants from Israel ($57,034, a difference of 0.32%), Immigrants from China ($56,638, a difference of 0.38%), Immigrants from South Central Asia ($57,114, a difference of 0.46%), Immigrants from Australia ($56,305, a difference of 0.97%), and Indian (Asian) ($56,253, a difference of 1.1%). Similarly, the demographic groups most similar to Filipinos are Immigrants from Taiwan ($61,151, a difference of 0.080%), Immigrants from India ($60,648, a difference of 0.91%), Immigrants from Hong Kong ($59,433, a difference of 3.0%), Thai ($59,237, a difference of 3.3%), and Immigrants from Singapore ($59,038, a difference of 3.7%).
| Demographics | Rating | Rank | Median Earnings |
| Filipinos | 100.0 /100 | #1 | Exceptional $61,197 |
| Immigrants | Taiwan | 100.0 /100 | #2 | Exceptional $61,151 |
| Immigrants | India | 100.0 /100 | #3 | Exceptional $60,648 |
| Immigrants | Hong Kong | 100.0 /100 | #4 | Exceptional $59,433 |
| Thais | 100.0 /100 | #5 | Exceptional $59,237 |
| Immigrants | Singapore | 100.0 /100 | #6 | Exceptional $59,038 |
| Iranians | 100.0 /100 | #7 | Exceptional $58,474 |
| Immigrants | Iran | 100.0 /100 | #8 | Exceptional $57,612 |
| Okinawans | 100.0 /100 | #9 | Exceptional $57,550 |
| Immigrants | South Central Asia | 100.0 /100 | #10 | Exceptional $57,114 |
| Immigrants | Israel | 100.0 /100 | #11 | Exceptional $57,034 |
| Immigrants | Ireland | 100.0 /100 | #12 | Exceptional $56,854 |
| Immigrants | China | 100.0 /100 | #13 | Exceptional $56,638 |
| Immigrants | Australia | 100.0 /100 | #14 | Exceptional $56,305 |
| Indians (Asian) | 100.0 /100 | #15 | Exceptional $56,253 |
| Immigrants | Eastern Asia | 100.0 /100 | #16 | Exceptional $56,183 |
| Eastern Europeans | 100.0 /100 | #17 | Exceptional $55,084 |
| Immigrants | Japan | 100.0 /100 | #18 | Exceptional $54,938 |
| Immigrants | Belgium | 100.0 /100 | #19 | Exceptional $54,679 |
| Cypriots | 100.0 /100 | #20 | Exceptional $54,589 |