Immigrants from Canada vs Barbadian Median Earnings
COMPARE
Immigrants from Canada
Barbadian
Median Earnings
Median Earnings Comparison
Immigrants from Canada
Barbadians
$50,192
MEDIAN EARNINGS
99.5/ 100
METRIC RATING
86th/ 347
METRIC RANK
$45,846
MEDIAN EARNINGS
30.5/ 100
METRIC RATING
197th/ 347
METRIC RANK
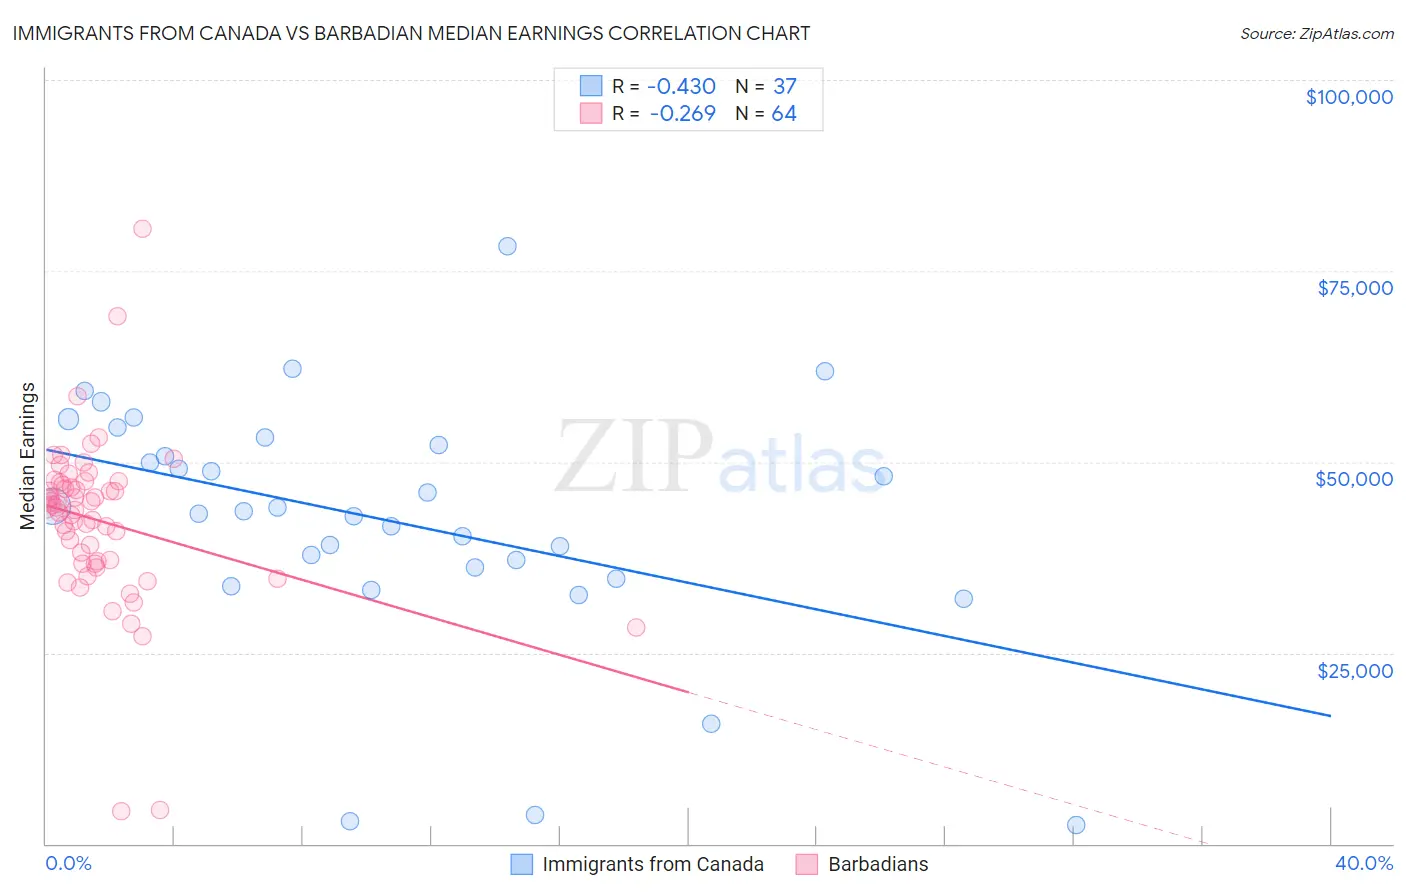
Immigrants from Canada vs Barbadian Median Earnings Correlation Chart
The statistical analysis conducted on geographies consisting of 459,326,577 people shows a moderate negative correlation between the proportion of Immigrants from Canada and median earnings in the United States with a correlation coefficient (R) of -0.430 and weighted average of $50,192. Similarly, the statistical analysis conducted on geographies consisting of 141,267,085 people shows a weak negative correlation between the proportion of Barbadians and median earnings in the United States with a correlation coefficient (R) of -0.269 and weighted average of $45,846, a difference of 9.5%.
Median Earnings Correlation Summary
| Measurement | Immigrants from Canada | Barbadian |
| Minimum | $2,499 | $4,250 |
| Maximum | $78,310 | $80,575 |
| Range | $75,811 | $76,325 |
| Mean | $42,254 | $42,285 |
| Median | $43,536 | $44,059 |
| Interquartile 25% (IQ1) | $35,442 | $36,766 |
| Interquartile 75% (IQ3) | $52,692 | $47,124 |
| Interquartile Range (IQR) | $17,250 | $10,358 |
| Standard Deviation (Sample) | $16,214 | $11,063 |
| Standard Deviation (Population) | $15,993 | $10,976 |
Similar Demographics by Median Earnings
Demographics Similar to Immigrants from Canada by Median Earnings
In terms of median earnings, the demographic groups most similar to Immigrants from Canada are Immigrants from Hungary ($50,227, a difference of 0.070%), Immigrants from Kazakhstan ($50,225, a difference of 0.070%), Immigrants from Uzbekistan ($50,151, a difference of 0.080%), Romanian ($50,244, a difference of 0.10%), and Albanian ($50,116, a difference of 0.15%).
| Demographics | Rating | Rank | Median Earnings |
| Laotians | 99.6 /100 | #79 | Exceptional $50,343 |
| Ukrainians | 99.6 /100 | #80 | Exceptional $50,320 |
| Immigrants | Southern Europe | 99.6 /100 | #81 | Exceptional $50,280 |
| Immigrants | Moldova | 99.5 /100 | #82 | Exceptional $50,274 |
| Romanians | 99.5 /100 | #83 | Exceptional $50,244 |
| Immigrants | Hungary | 99.5 /100 | #84 | Exceptional $50,227 |
| Immigrants | Kazakhstan | 99.5 /100 | #85 | Exceptional $50,225 |
| Immigrants | Canada | 99.5 /100 | #86 | Exceptional $50,192 |
| Immigrants | Uzbekistan | 99.5 /100 | #87 | Exceptional $50,151 |
| Albanians | 99.4 /100 | #88 | Exceptional $50,116 |
| Immigrants | North America | 99.4 /100 | #89 | Exceptional $50,108 |
| Italians | 99.3 /100 | #90 | Exceptional $49,915 |
| Macedonians | 99.2 /100 | #91 | Exceptional $49,893 |
| Immigrants | Argentina | 99.2 /100 | #92 | Exceptional $49,841 |
| Armenians | 99.1 /100 | #93 | Exceptional $49,804 |
Demographics Similar to Barbadians by Median Earnings
In terms of median earnings, the demographic groups most similar to Barbadians are Yugoslavian ($45,846, a difference of 0.0%), Trinidadian and Tobagonian ($45,820, a difference of 0.060%), Immigrants from Barbados ($45,816, a difference of 0.060%), Immigrants from the Azores ($45,812, a difference of 0.070%), and Immigrants from St. Vincent and the Grenadines ($45,908, a difference of 0.14%).
| Demographics | Rating | Rank | Median Earnings |
| French Canadians | 36.1 /100 | #190 | Fair $46,026 |
| Finns | 33.4 /100 | #191 | Fair $45,940 |
| Germans | 33.2 /100 | #192 | Fair $45,935 |
| Guamanians/Chamorros | 33.2 /100 | #193 | Fair $45,933 |
| Immigrants | Costa Rica | 33.0 /100 | #194 | Fair $45,928 |
| Immigrants | St. Vincent and the Grenadines | 32.4 /100 | #195 | Fair $45,908 |
| Yugoslavians | 30.5 /100 | #196 | Fair $45,846 |
| Barbadians | 30.5 /100 | #197 | Fair $45,846 |
| Trinidadians and Tobagonians | 29.7 /100 | #198 | Fair $45,820 |
| Immigrants | Barbados | 29.6 /100 | #199 | Fair $45,816 |
| Immigrants | Azores | 29.5 /100 | #200 | Fair $45,812 |
| Celtics | 27.2 /100 | #201 | Fair $45,732 |
| Immigrants | Trinidad and Tobago | 27.1 /100 | #202 | Fair $45,729 |
| Welsh | 26.6 /100 | #203 | Fair $45,710 |
| Immigrants | Uruguay | 25.9 /100 | #204 | Fair $45,682 |