Immigrants from Turkey vs Immigrants from Syria Householder Income Ages 45 - 64 years
COMPARE
Immigrants from Turkey
Immigrants from Syria
Householder Income Ages 45 - 64 years
Householder Income Ages 45 - 64 years Comparison
Immigrants from Turkey
Immigrants from Syria
$114,407
HOUSEHOLDER INCOME AGES 45 - 64 YEARS
99.9/ 100
METRIC RATING
39th/ 347
METRIC RANK
$104,858
HOUSEHOLDER INCOME AGES 45 - 64 YEARS
90.7/ 100
METRIC RATING
131st/ 347
METRIC RANK
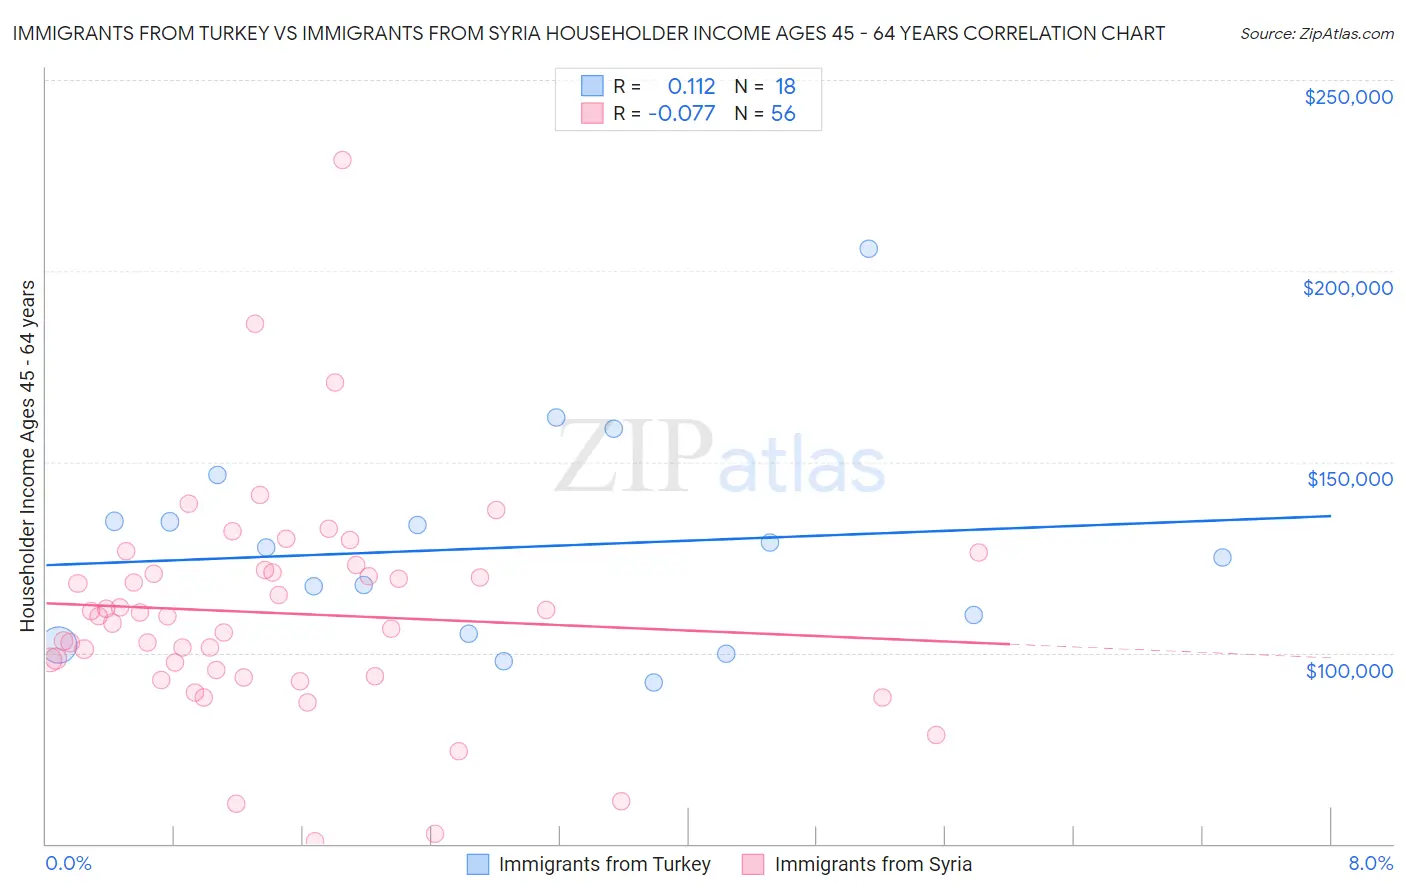
Immigrants from Turkey vs Immigrants from Syria Householder Income Ages 45 - 64 years Correlation Chart
The statistical analysis conducted on geographies consisting of 222,848,183 people shows a poor positive correlation between the proportion of Immigrants from Turkey and household income with householder between the ages 45 and 64 in the United States with a correlation coefficient (R) of 0.112 and weighted average of $114,407. Similarly, the statistical analysis conducted on geographies consisting of 174,068,241 people shows a slight negative correlation between the proportion of Immigrants from Syria and household income with householder between the ages 45 and 64 in the United States with a correlation coefficient (R) of -0.077 and weighted average of $104,858, a difference of 9.1%.
Householder Income Ages 45 - 64 years Correlation Summary
| Measurement | Immigrants from Turkey | Immigrants from Syria |
| Minimum | $92,363 | $50,774 |
| Maximum | $205,770 | $228,894 |
| Range | $113,407 | $178,120 |
| Mean | $127,654 | $110,346 |
| Median | $126,227 | $109,693 |
| Interquartile 25% (IQ1) | $104,873 | $94,783 |
| Interquartile 75% (IQ3) | $134,485 | $121,434 |
| Interquartile Range (IQR) | $29,612 | $26,651 |
| Standard Deviation (Sample) | $27,992 | $29,383 |
| Standard Deviation (Population) | $27,203 | $29,119 |
Similar Demographics by Householder Income Ages 45 - 64 years
Demographics Similar to Immigrants from Turkey by Householder Income Ages 45 - 64 years
In terms of householder income ages 45 - 64 years, the demographic groups most similar to Immigrants from Turkey are Immigrants from Pakistan ($114,434, a difference of 0.020%), Cambodian ($114,342, a difference of 0.060%), Immigrants from Lithuania ($114,336, a difference of 0.060%), Estonian ($114,220, a difference of 0.16%), and Israeli ($114,186, a difference of 0.19%).
| Demographics | Rating | Rank | Householder Income Ages 45 - 64 years |
| Russians | 100.0 /100 | #32 | Exceptional $116,328 |
| Chinese | 100.0 /100 | #33 | Exceptional $116,156 |
| Immigrants | Denmark | 100.0 /100 | #34 | Exceptional $116,000 |
| Latvians | 100.0 /100 | #35 | Exceptional $115,957 |
| Immigrants | Switzerland | 100.0 /100 | #36 | Exceptional $115,934 |
| Maltese | 99.9 /100 | #37 | Exceptional $114,754 |
| Immigrants | Pakistan | 99.9 /100 | #38 | Exceptional $114,434 |
| Immigrants | Turkey | 99.9 /100 | #39 | Exceptional $114,407 |
| Cambodians | 99.9 /100 | #40 | Exceptional $114,342 |
| Immigrants | Lithuania | 99.9 /100 | #41 | Exceptional $114,336 |
| Estonians | 99.9 /100 | #42 | Exceptional $114,220 |
| Israelis | 99.9 /100 | #43 | Exceptional $114,186 |
| Bulgarians | 99.9 /100 | #44 | Exceptional $113,883 |
| Immigrants | France | 99.9 /100 | #45 | Exceptional $113,680 |
| Immigrants | Greece | 99.9 /100 | #46 | Exceptional $113,548 |
Demographics Similar to Immigrants from Syria by Householder Income Ages 45 - 64 years
In terms of householder income ages 45 - 64 years, the demographic groups most similar to Immigrants from Syria are Lebanese ($104,734, a difference of 0.12%), Immigrants from Zimbabwe ($104,992, a difference of 0.13%), Peruvian ($105,070, a difference of 0.20%), Native Hawaiian ($105,149, a difference of 0.28%), and Arab ($104,566, a difference of 0.28%).
| Demographics | Rating | Rank | Householder Income Ages 45 - 64 years |
| Immigrants | Northern Africa | 92.8 /100 | #124 | Exceptional $105,430 |
| Pakistanis | 92.4 /100 | #125 | Exceptional $105,317 |
| Portuguese | 92.4 /100 | #126 | Exceptional $105,309 |
| Immigrants | Saudi Arabia | 92.2 /100 | #127 | Exceptional $105,249 |
| Native Hawaiians | 91.8 /100 | #128 | Exceptional $105,149 |
| Peruvians | 91.5 /100 | #129 | Exceptional $105,070 |
| Immigrants | Zimbabwe | 91.2 /100 | #130 | Exceptional $104,992 |
| Immigrants | Syria | 90.7 /100 | #131 | Exceptional $104,858 |
| Lebanese | 90.1 /100 | #132 | Exceptional $104,734 |
| Arabs | 89.3 /100 | #133 | Excellent $104,566 |
| Canadians | 89.3 /100 | #134 | Excellent $104,560 |
| Brazilians | 88.6 /100 | #135 | Excellent $104,408 |
| Taiwanese | 87.4 /100 | #136 | Excellent $104,180 |
| Hungarians | 85.8 /100 | #137 | Excellent $103,913 |
| Ethiopians | 84.7 /100 | #138 | Excellent $103,736 |