Immigrants from Turkey vs Immigrants from England Householder Income Ages 45 - 64 years
COMPARE
Immigrants from Turkey
Immigrants from England
Householder Income Ages 45 - 64 years
Householder Income Ages 45 - 64 years Comparison
Immigrants from Turkey
Immigrants from England
$114,407
HOUSEHOLDER INCOME AGES 45 - 64 YEARS
99.9/ 100
METRIC RATING
39th/ 347
METRIC RANK
$109,446
HOUSEHOLDER INCOME AGES 45 - 64 YEARS
99.0/ 100
METRIC RATING
77th/ 347
METRIC RANK
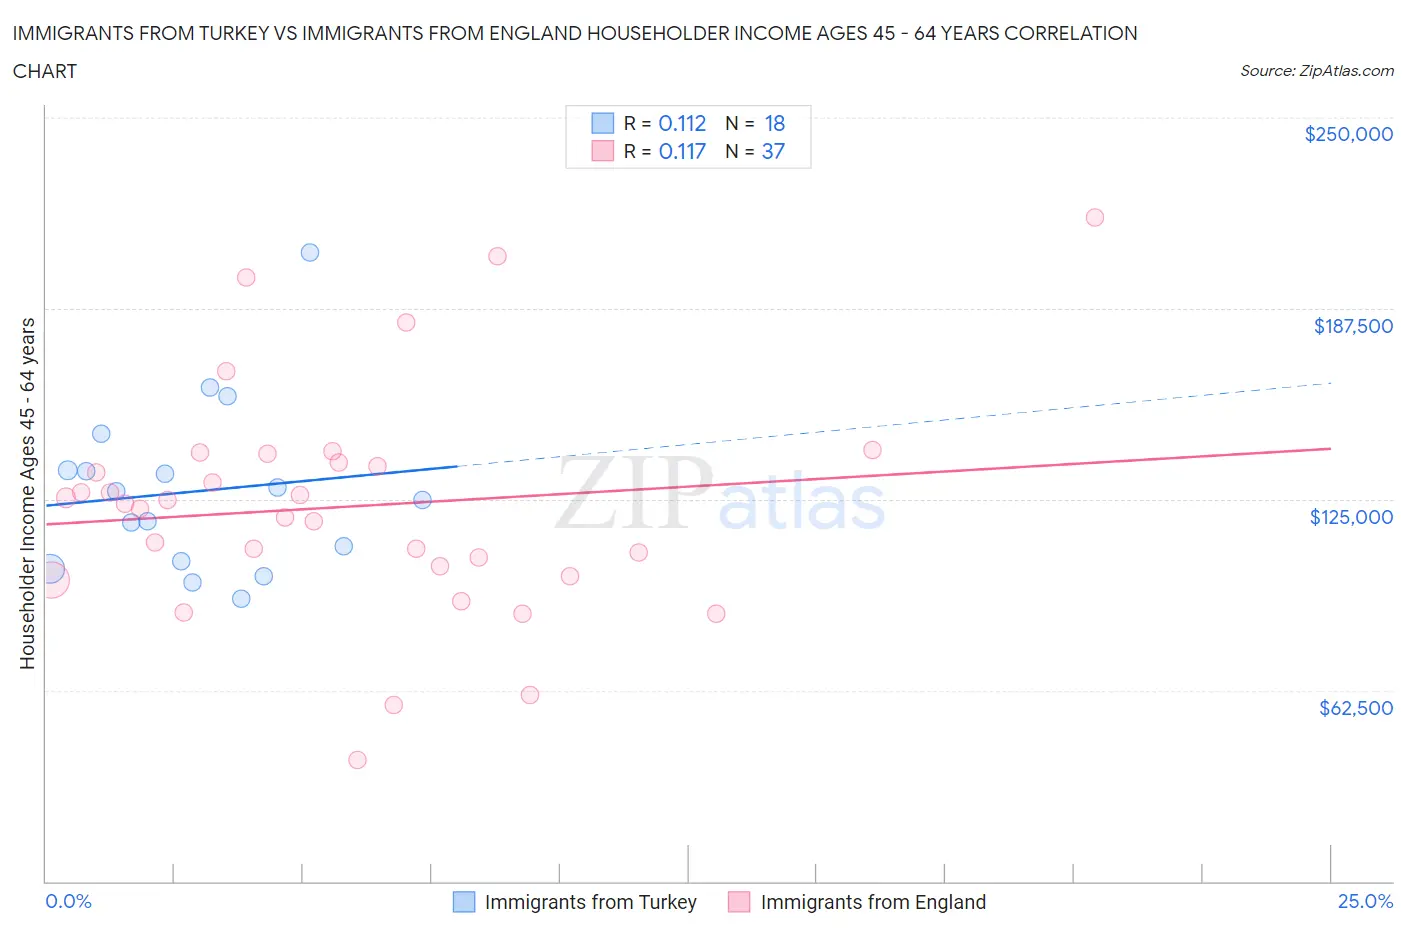
Immigrants from Turkey vs Immigrants from England Householder Income Ages 45 - 64 years Correlation Chart
The statistical analysis conducted on geographies consisting of 222,848,183 people shows a poor positive correlation between the proportion of Immigrants from Turkey and household income with householder between the ages 45 and 64 in the United States with a correlation coefficient (R) of 0.112 and weighted average of $114,407. Similarly, the statistical analysis conducted on geographies consisting of 391,386,489 people shows a poor positive correlation between the proportion of Immigrants from England and household income with householder between the ages 45 and 64 in the United States with a correlation coefficient (R) of 0.117 and weighted average of $109,446, a difference of 4.5%.
Householder Income Ages 45 - 64 years Correlation Summary
| Measurement | Immigrants from Turkey | Immigrants from England |
| Minimum | $92,363 | $39,802 |
| Maximum | $205,770 | $217,188 |
| Range | $113,407 | $177,386 |
| Mean | $127,654 | $122,668 |
| Median | $126,227 | $123,541 |
| Interquartile 25% (IQ1) | $104,873 | $101,375 |
| Interquartile 75% (IQ3) | $134,485 | $138,511 |
| Interquartile Range (IQR) | $29,612 | $37,136 |
| Standard Deviation (Sample) | $27,992 | $37,553 |
| Standard Deviation (Population) | $27,203 | $37,042 |
Similar Demographics by Householder Income Ages 45 - 64 years
Demographics Similar to Immigrants from Turkey by Householder Income Ages 45 - 64 years
In terms of householder income ages 45 - 64 years, the demographic groups most similar to Immigrants from Turkey are Immigrants from Pakistan ($114,434, a difference of 0.020%), Cambodian ($114,342, a difference of 0.060%), Immigrants from Lithuania ($114,336, a difference of 0.060%), Estonian ($114,220, a difference of 0.16%), and Israeli ($114,186, a difference of 0.19%).
| Demographics | Rating | Rank | Householder Income Ages 45 - 64 years |
| Russians | 100.0 /100 | #32 | Exceptional $116,328 |
| Chinese | 100.0 /100 | #33 | Exceptional $116,156 |
| Immigrants | Denmark | 100.0 /100 | #34 | Exceptional $116,000 |
| Latvians | 100.0 /100 | #35 | Exceptional $115,957 |
| Immigrants | Switzerland | 100.0 /100 | #36 | Exceptional $115,934 |
| Maltese | 99.9 /100 | #37 | Exceptional $114,754 |
| Immigrants | Pakistan | 99.9 /100 | #38 | Exceptional $114,434 |
| Immigrants | Turkey | 99.9 /100 | #39 | Exceptional $114,407 |
| Cambodians | 99.9 /100 | #40 | Exceptional $114,342 |
| Immigrants | Lithuania | 99.9 /100 | #41 | Exceptional $114,336 |
| Estonians | 99.9 /100 | #42 | Exceptional $114,220 |
| Israelis | 99.9 /100 | #43 | Exceptional $114,186 |
| Bulgarians | 99.9 /100 | #44 | Exceptional $113,883 |
| Immigrants | France | 99.9 /100 | #45 | Exceptional $113,680 |
| Immigrants | Greece | 99.9 /100 | #46 | Exceptional $113,548 |
Demographics Similar to Immigrants from England by Householder Income Ages 45 - 64 years
In terms of householder income ages 45 - 64 years, the demographic groups most similar to Immigrants from England are Paraguayan ($109,447, a difference of 0.0%), Immigrants from Canada ($109,402, a difference of 0.040%), Immigrants from Bulgaria ($109,379, a difference of 0.060%), Jordanian ($109,376, a difference of 0.060%), and Immigrants from Eastern Europe ($109,335, a difference of 0.10%).
| Demographics | Rating | Rank | Householder Income Ages 45 - 64 years |
| Koreans | 99.3 /100 | #70 | Exceptional $110,334 |
| Italians | 99.3 /100 | #71 | Exceptional $110,224 |
| Assyrians/Chaldeans/Syriacs | 99.3 /100 | #72 | Exceptional $110,201 |
| Argentineans | 99.3 /100 | #73 | Exceptional $110,103 |
| Immigrants | Egypt | 99.2 /100 | #74 | Exceptional $109,941 |
| South Africans | 99.1 /100 | #75 | Exceptional $109,719 |
| Paraguayans | 99.0 /100 | #76 | Exceptional $109,447 |
| Immigrants | England | 99.0 /100 | #77 | Exceptional $109,446 |
| Immigrants | Canada | 99.0 /100 | #78 | Exceptional $109,402 |
| Immigrants | Bulgaria | 98.9 /100 | #79 | Exceptional $109,379 |
| Jordanians | 98.9 /100 | #80 | Exceptional $109,376 |
| Immigrants | Eastern Europe | 98.9 /100 | #81 | Exceptional $109,335 |
| Immigrants | North America | 98.8 /100 | #82 | Exceptional $109,198 |
| Immigrants | Spain | 98.8 /100 | #83 | Exceptional $109,051 |
| Immigrants | Western Europe | 98.6 /100 | #84 | Exceptional $108,824 |