Immigrants from Turkey vs Immigrants from Serbia Householder Income Ages 45 - 64 years
COMPARE
Immigrants from Turkey
Immigrants from Serbia
Householder Income Ages 45 - 64 years
Householder Income Ages 45 - 64 years Comparison
Immigrants from Turkey
Immigrants from Serbia
$114,407
HOUSEHOLDER INCOME AGES 45 - 64 YEARS
99.9/ 100
METRIC RATING
39th/ 347
METRIC RANK
$107,569
HOUSEHOLDER INCOME AGES 45 - 64 YEARS
97.4/ 100
METRIC RATING
100th/ 347
METRIC RANK
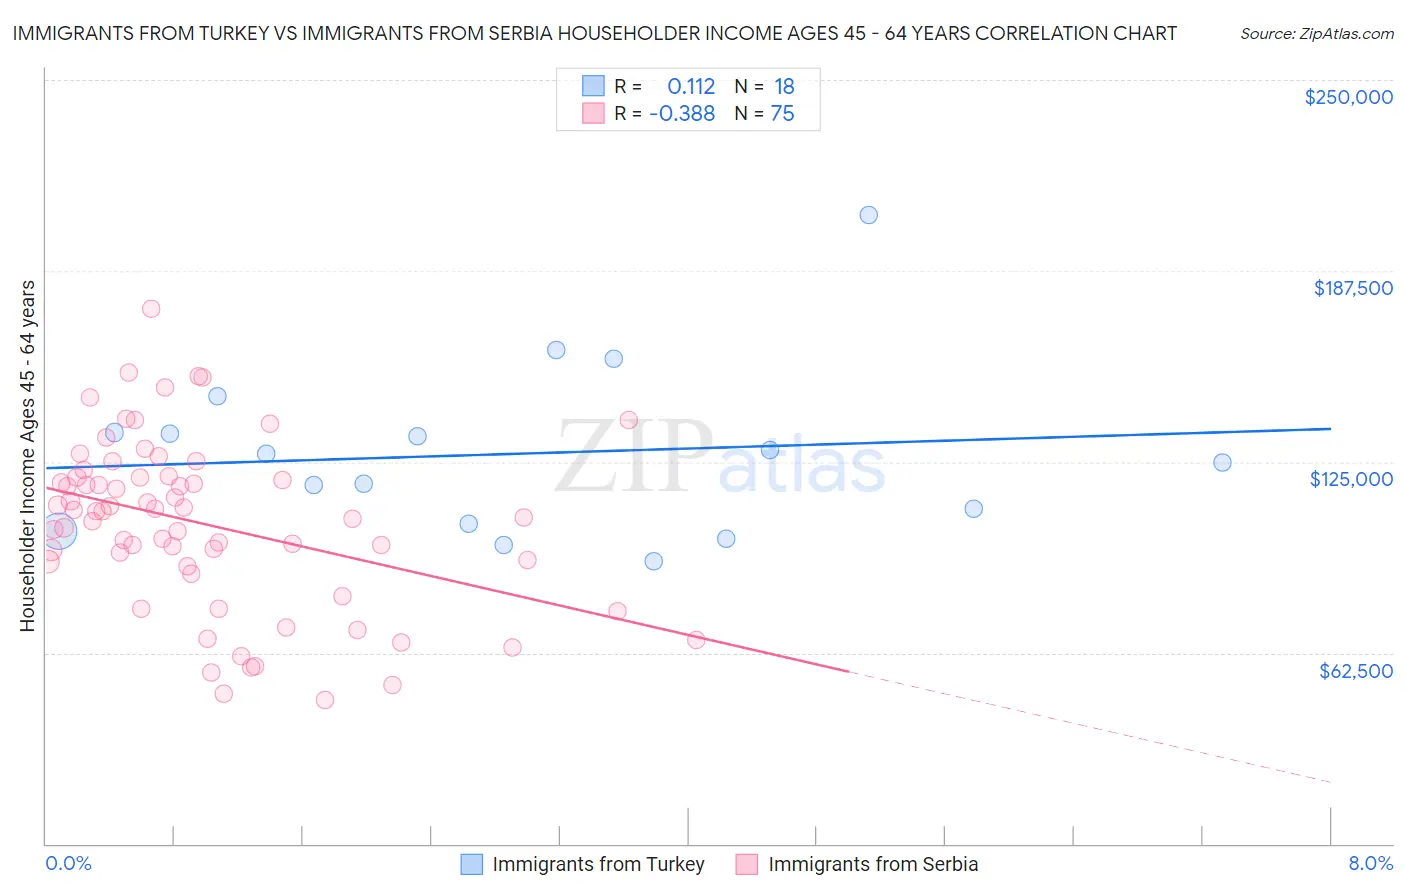
Immigrants from Turkey vs Immigrants from Serbia Householder Income Ages 45 - 64 years Correlation Chart
The statistical analysis conducted on geographies consisting of 222,848,183 people shows a poor positive correlation between the proportion of Immigrants from Turkey and household income with householder between the ages 45 and 64 in the United States with a correlation coefficient (R) of 0.112 and weighted average of $114,407. Similarly, the statistical analysis conducted on geographies consisting of 131,681,242 people shows a mild negative correlation between the proportion of Immigrants from Serbia and household income with householder between the ages 45 and 64 in the United States with a correlation coefficient (R) of -0.388 and weighted average of $107,569, a difference of 6.4%.
Householder Income Ages 45 - 64 years Correlation Summary
| Measurement | Immigrants from Turkey | Immigrants from Serbia |
| Minimum | $92,363 | $47,000 |
| Maximum | $205,770 | $175,247 |
| Range | $113,407 | $128,247 |
| Mean | $127,654 | $104,599 |
| Median | $126,227 | $108,917 |
| Interquartile 25% (IQ1) | $104,873 | $90,676 |
| Interquartile 75% (IQ3) | $134,485 | $119,792 |
| Interquartile Range (IQR) | $29,612 | $29,116 |
| Standard Deviation (Sample) | $27,992 | $27,672 |
| Standard Deviation (Population) | $27,203 | $27,487 |
Similar Demographics by Householder Income Ages 45 - 64 years
Demographics Similar to Immigrants from Turkey by Householder Income Ages 45 - 64 years
In terms of householder income ages 45 - 64 years, the demographic groups most similar to Immigrants from Turkey are Immigrants from Pakistan ($114,434, a difference of 0.020%), Cambodian ($114,342, a difference of 0.060%), Immigrants from Lithuania ($114,336, a difference of 0.060%), Estonian ($114,220, a difference of 0.16%), and Israeli ($114,186, a difference of 0.19%).
| Demographics | Rating | Rank | Householder Income Ages 45 - 64 years |
| Russians | 100.0 /100 | #32 | Exceptional $116,328 |
| Chinese | 100.0 /100 | #33 | Exceptional $116,156 |
| Immigrants | Denmark | 100.0 /100 | #34 | Exceptional $116,000 |
| Latvians | 100.0 /100 | #35 | Exceptional $115,957 |
| Immigrants | Switzerland | 100.0 /100 | #36 | Exceptional $115,934 |
| Maltese | 99.9 /100 | #37 | Exceptional $114,754 |
| Immigrants | Pakistan | 99.9 /100 | #38 | Exceptional $114,434 |
| Immigrants | Turkey | 99.9 /100 | #39 | Exceptional $114,407 |
| Cambodians | 99.9 /100 | #40 | Exceptional $114,342 |
| Immigrants | Lithuania | 99.9 /100 | #41 | Exceptional $114,336 |
| Estonians | 99.9 /100 | #42 | Exceptional $114,220 |
| Israelis | 99.9 /100 | #43 | Exceptional $114,186 |
| Bulgarians | 99.9 /100 | #44 | Exceptional $113,883 |
| Immigrants | France | 99.9 /100 | #45 | Exceptional $113,680 |
| Immigrants | Greece | 99.9 /100 | #46 | Exceptional $113,548 |
Demographics Similar to Immigrants from Serbia by Householder Income Ages 45 - 64 years
In terms of householder income ages 45 - 64 years, the demographic groups most similar to Immigrants from Serbia are Palestinian ($107,721, a difference of 0.14%), Immigrants from Kazakhstan ($107,378, a difference of 0.18%), Immigrants from Southern Europe ($107,775, a difference of 0.19%), Immigrants from Moldova ($107,357, a difference of 0.20%), and Northern European ($107,870, a difference of 0.28%).
| Demographics | Rating | Rank | Householder Income Ages 45 - 64 years |
| Immigrants | Croatia | 98.2 /100 | #93 | Exceptional $108,304 |
| Sri Lankans | 98.2 /100 | #94 | Exceptional $108,270 |
| Immigrants | Hungary | 98.2 /100 | #95 | Exceptional $108,267 |
| Immigrants | Argentina | 98.2 /100 | #96 | Exceptional $108,264 |
| Northern Europeans | 97.8 /100 | #97 | Exceptional $107,870 |
| Immigrants | Southern Europe | 97.7 /100 | #98 | Exceptional $107,775 |
| Palestinians | 97.6 /100 | #99 | Exceptional $107,721 |
| Immigrants | Serbia | 97.4 /100 | #100 | Exceptional $107,569 |
| Immigrants | Kazakhstan | 97.2 /100 | #101 | Exceptional $107,378 |
| Immigrants | Moldova | 97.1 /100 | #102 | Exceptional $107,357 |
| Syrians | 96.9 /100 | #103 | Exceptional $107,207 |
| Immigrants | Ukraine | 96.7 /100 | #104 | Exceptional $107,079 |
| Macedonians | 96.7 /100 | #105 | Exceptional $107,074 |
| Armenians | 96.6 /100 | #106 | Exceptional $107,002 |
| Immigrants | Fiji | 96.5 /100 | #107 | Exceptional $106,952 |