Immigrants from Turkey vs Immigrants from South Africa Householder Income Ages 45 - 64 years
COMPARE
Immigrants from Turkey
Immigrants from South Africa
Householder Income Ages 45 - 64 years
Householder Income Ages 45 - 64 years Comparison
Immigrants from Turkey
Immigrants from South Africa
$114,407
HOUSEHOLDER INCOME AGES 45 - 64 YEARS
99.9/ 100
METRIC RATING
39th/ 347
METRIC RANK
$112,886
HOUSEHOLDER INCOME AGES 45 - 64 YEARS
99.8/ 100
METRIC RATING
51st/ 347
METRIC RANK
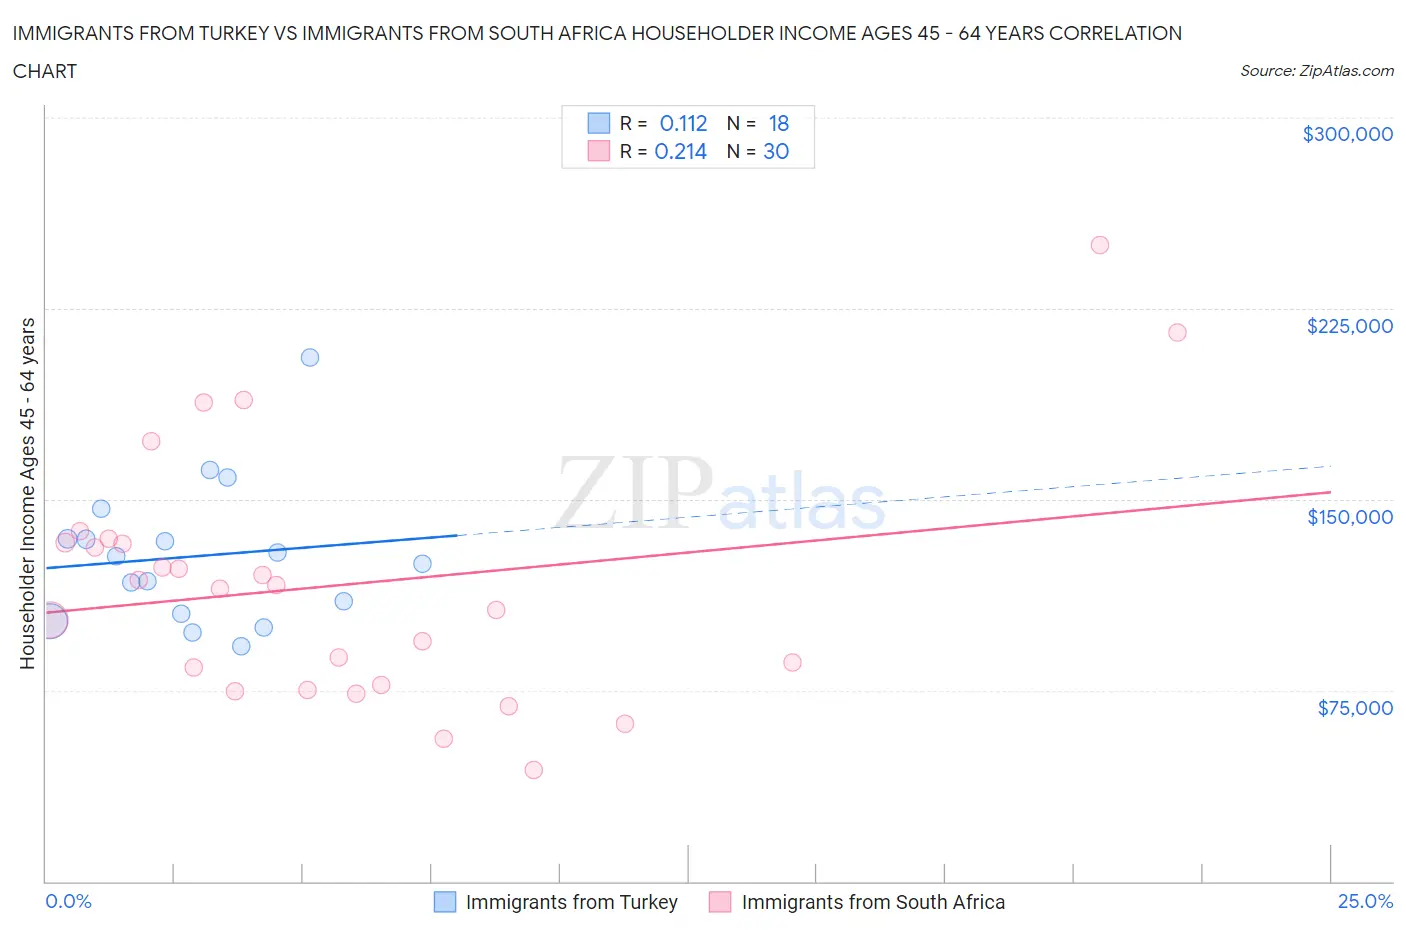
Immigrants from Turkey vs Immigrants from South Africa Householder Income Ages 45 - 64 years Correlation Chart
The statistical analysis conducted on geographies consisting of 222,848,183 people shows a poor positive correlation between the proportion of Immigrants from Turkey and household income with householder between the ages 45 and 64 in the United States with a correlation coefficient (R) of 0.112 and weighted average of $114,407. Similarly, the statistical analysis conducted on geographies consisting of 233,154,360 people shows a weak positive correlation between the proportion of Immigrants from South Africa and household income with householder between the ages 45 and 64 in the United States with a correlation coefficient (R) of 0.214 and weighted average of $112,886, a difference of 1.3%.
Householder Income Ages 45 - 64 years Correlation Summary
| Measurement | Immigrants from Turkey | Immigrants from South Africa |
| Minimum | $92,363 | $43,750 |
| Maximum | $205,770 | $250,001 |
| Range | $113,407 | $206,251 |
| Mean | $127,654 | $116,416 |
| Median | $126,227 | $115,780 |
| Interquartile 25% (IQ1) | $104,873 | $77,125 |
| Interquartile 75% (IQ3) | $134,485 | $133,043 |
| Interquartile Range (IQR) | $29,612 | $55,918 |
| Standard Deviation (Sample) | $27,992 | $48,210 |
| Standard Deviation (Population) | $27,203 | $47,400 |
Demographics Similar to Immigrants from Turkey and Immigrants from South Africa by Householder Income Ages 45 - 64 years
In terms of householder income ages 45 - 64 years, the demographic groups most similar to Immigrants from Turkey are Immigrants from Pakistan ($114,434, a difference of 0.020%), Cambodian ($114,342, a difference of 0.060%), Immigrants from Lithuania ($114,336, a difference of 0.060%), Estonian ($114,220, a difference of 0.16%), and Israeli ($114,186, a difference of 0.19%). Similarly, the demographic groups most similar to Immigrants from South Africa are Immigrants from Malaysia ($112,796, a difference of 0.080%), Afghan ($112,676, a difference of 0.19%), Immigrants from Austria ($113,140, a difference of 0.22%), Greek ($112,630, a difference of 0.23%), and Immigrants from Russia ($113,215, a difference of 0.29%).
| Demographics | Rating | Rank | Householder Income Ages 45 - 64 years |
| Latvians | 100.0 /100 | #35 | Exceptional $115,957 |
| Immigrants | Switzerland | 100.0 /100 | #36 | Exceptional $115,934 |
| Maltese | 99.9 /100 | #37 | Exceptional $114,754 |
| Immigrants | Pakistan | 99.9 /100 | #38 | Exceptional $114,434 |
| Immigrants | Turkey | 99.9 /100 | #39 | Exceptional $114,407 |
| Cambodians | 99.9 /100 | #40 | Exceptional $114,342 |
| Immigrants | Lithuania | 99.9 /100 | #41 | Exceptional $114,336 |
| Estonians | 99.9 /100 | #42 | Exceptional $114,220 |
| Israelis | 99.9 /100 | #43 | Exceptional $114,186 |
| Bulgarians | 99.9 /100 | #44 | Exceptional $113,883 |
| Immigrants | France | 99.9 /100 | #45 | Exceptional $113,680 |
| Immigrants | Greece | 99.9 /100 | #46 | Exceptional $113,548 |
| Australians | 99.9 /100 | #47 | Exceptional $113,533 |
| Immigrants | Indonesia | 99.9 /100 | #48 | Exceptional $113,519 |
| Immigrants | Russia | 99.8 /100 | #49 | Exceptional $113,215 |
| Immigrants | Austria | 99.8 /100 | #50 | Exceptional $113,140 |
| Immigrants | South Africa | 99.8 /100 | #51 | Exceptional $112,886 |
| Immigrants | Malaysia | 99.8 /100 | #52 | Exceptional $112,796 |
| Afghans | 99.8 /100 | #53 | Exceptional $112,676 |
| Greeks | 99.8 /100 | #54 | Exceptional $112,630 |
| Lithuanians | 99.8 /100 | #55 | Exceptional $112,484 |