Hmong vs Immigrants from Syria Householder Income Ages 45 - 64 years
COMPARE
Hmong
Immigrants from Syria
Householder Income Ages 45 - 64 years
Householder Income Ages 45 - 64 years Comparison
Hmong
Immigrants from Syria
$88,115
HOUSEHOLDER INCOME AGES 45 - 64 YEARS
0.2/ 100
METRIC RATING
267th/ 347
METRIC RANK
$104,858
HOUSEHOLDER INCOME AGES 45 - 64 YEARS
90.7/ 100
METRIC RATING
131st/ 347
METRIC RANK
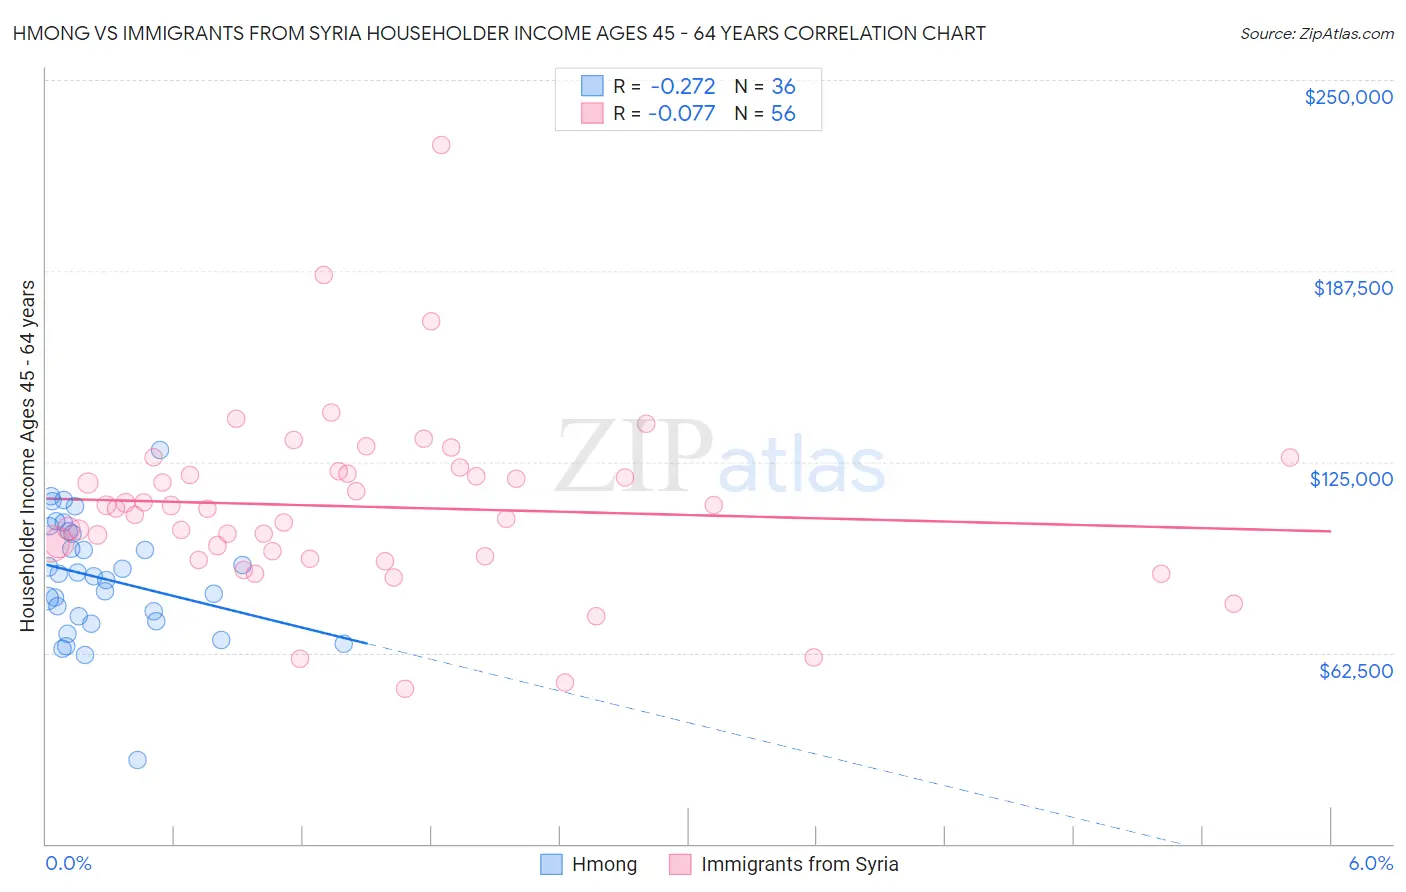
Hmong vs Immigrants from Syria Householder Income Ages 45 - 64 years Correlation Chart
The statistical analysis conducted on geographies consisting of 24,653,946 people shows a weak negative correlation between the proportion of Hmong and household income with householder between the ages 45 and 64 in the United States with a correlation coefficient (R) of -0.272 and weighted average of $88,115. Similarly, the statistical analysis conducted on geographies consisting of 174,068,241 people shows a slight negative correlation between the proportion of Immigrants from Syria and household income with householder between the ages 45 and 64 in the United States with a correlation coefficient (R) of -0.077 and weighted average of $104,858, a difference of 19.0%.
Householder Income Ages 45 - 64 years Correlation Summary
| Measurement | Hmong | Immigrants from Syria |
| Minimum | $27,563 | $50,774 |
| Maximum | $128,750 | $228,894 |
| Range | $101,187 | $178,120 |
| Mean | $86,810 | $110,346 |
| Median | $88,019 | $109,693 |
| Interquartile 25% (IQ1) | $73,534 | $94,783 |
| Interquartile 75% (IQ3) | $101,905 | $121,434 |
| Interquartile Range (IQR) | $28,372 | $26,651 |
| Standard Deviation (Sample) | $19,538 | $29,383 |
| Standard Deviation (Population) | $19,264 | $29,119 |
Similar Demographics by Householder Income Ages 45 - 64 years
Demographics Similar to Hmong by Householder Income Ages 45 - 64 years
In terms of householder income ages 45 - 64 years, the demographic groups most similar to Hmong are Immigrants from West Indies ($88,164, a difference of 0.050%), Jamaican ($88,327, a difference of 0.24%), Immigrants from Micronesia ($87,864, a difference of 0.29%), Osage ($88,390, a difference of 0.31%), and Spanish American ($87,836, a difference of 0.32%).
| Demographics | Rating | Rank | Householder Income Ages 45 - 64 years |
| Liberians | 0.3 /100 | #260 | Tragic $88,929 |
| Belizeans | 0.3 /100 | #261 | Tragic $88,684 |
| Somalis | 0.3 /100 | #262 | Tragic $88,600 |
| Immigrants | Senegal | 0.3 /100 | #263 | Tragic $88,421 |
| Osage | 0.3 /100 | #264 | Tragic $88,390 |
| Jamaicans | 0.2 /100 | #265 | Tragic $88,327 |
| Immigrants | West Indies | 0.2 /100 | #266 | Tragic $88,164 |
| Hmong | 0.2 /100 | #267 | Tragic $88,115 |
| Immigrants | Micronesia | 0.2 /100 | #268 | Tragic $87,864 |
| Spanish Americans | 0.2 /100 | #269 | Tragic $87,836 |
| Immigrants | Liberia | 0.2 /100 | #270 | Tragic $87,739 |
| Guatemalans | 0.2 /100 | #271 | Tragic $87,705 |
| Cape Verdeans | 0.2 /100 | #272 | Tragic $87,580 |
| Spanish American Indians | 0.2 /100 | #273 | Tragic $87,561 |
| Iroquois | 0.1 /100 | #274 | Tragic $87,255 |
Demographics Similar to Immigrants from Syria by Householder Income Ages 45 - 64 years
In terms of householder income ages 45 - 64 years, the demographic groups most similar to Immigrants from Syria are Lebanese ($104,734, a difference of 0.12%), Immigrants from Zimbabwe ($104,992, a difference of 0.13%), Peruvian ($105,070, a difference of 0.20%), Native Hawaiian ($105,149, a difference of 0.28%), and Arab ($104,566, a difference of 0.28%).
| Demographics | Rating | Rank | Householder Income Ages 45 - 64 years |
| Immigrants | Northern Africa | 92.8 /100 | #124 | Exceptional $105,430 |
| Pakistanis | 92.4 /100 | #125 | Exceptional $105,317 |
| Portuguese | 92.4 /100 | #126 | Exceptional $105,309 |
| Immigrants | Saudi Arabia | 92.2 /100 | #127 | Exceptional $105,249 |
| Native Hawaiians | 91.8 /100 | #128 | Exceptional $105,149 |
| Peruvians | 91.5 /100 | #129 | Exceptional $105,070 |
| Immigrants | Zimbabwe | 91.2 /100 | #130 | Exceptional $104,992 |
| Immigrants | Syria | 90.7 /100 | #131 | Exceptional $104,858 |
| Lebanese | 90.1 /100 | #132 | Exceptional $104,734 |
| Arabs | 89.3 /100 | #133 | Excellent $104,566 |
| Canadians | 89.3 /100 | #134 | Excellent $104,560 |
| Brazilians | 88.6 /100 | #135 | Excellent $104,408 |
| Taiwanese | 87.4 /100 | #136 | Excellent $104,180 |
| Hungarians | 85.8 /100 | #137 | Excellent $103,913 |
| Ethiopians | 84.7 /100 | #138 | Excellent $103,736 |