Immigrants from Moldova vs Immigrants from Syria Householder Income Ages 45 - 64 years
COMPARE
Immigrants from Moldova
Immigrants from Syria
Householder Income Ages 45 - 64 years
Householder Income Ages 45 - 64 years Comparison
Immigrants from Moldova
Immigrants from Syria
$107,357
HOUSEHOLDER INCOME AGES 45 - 64 YEARS
97.1/ 100
METRIC RATING
102nd/ 347
METRIC RANK
$104,858
HOUSEHOLDER INCOME AGES 45 - 64 YEARS
90.7/ 100
METRIC RATING
131st/ 347
METRIC RANK
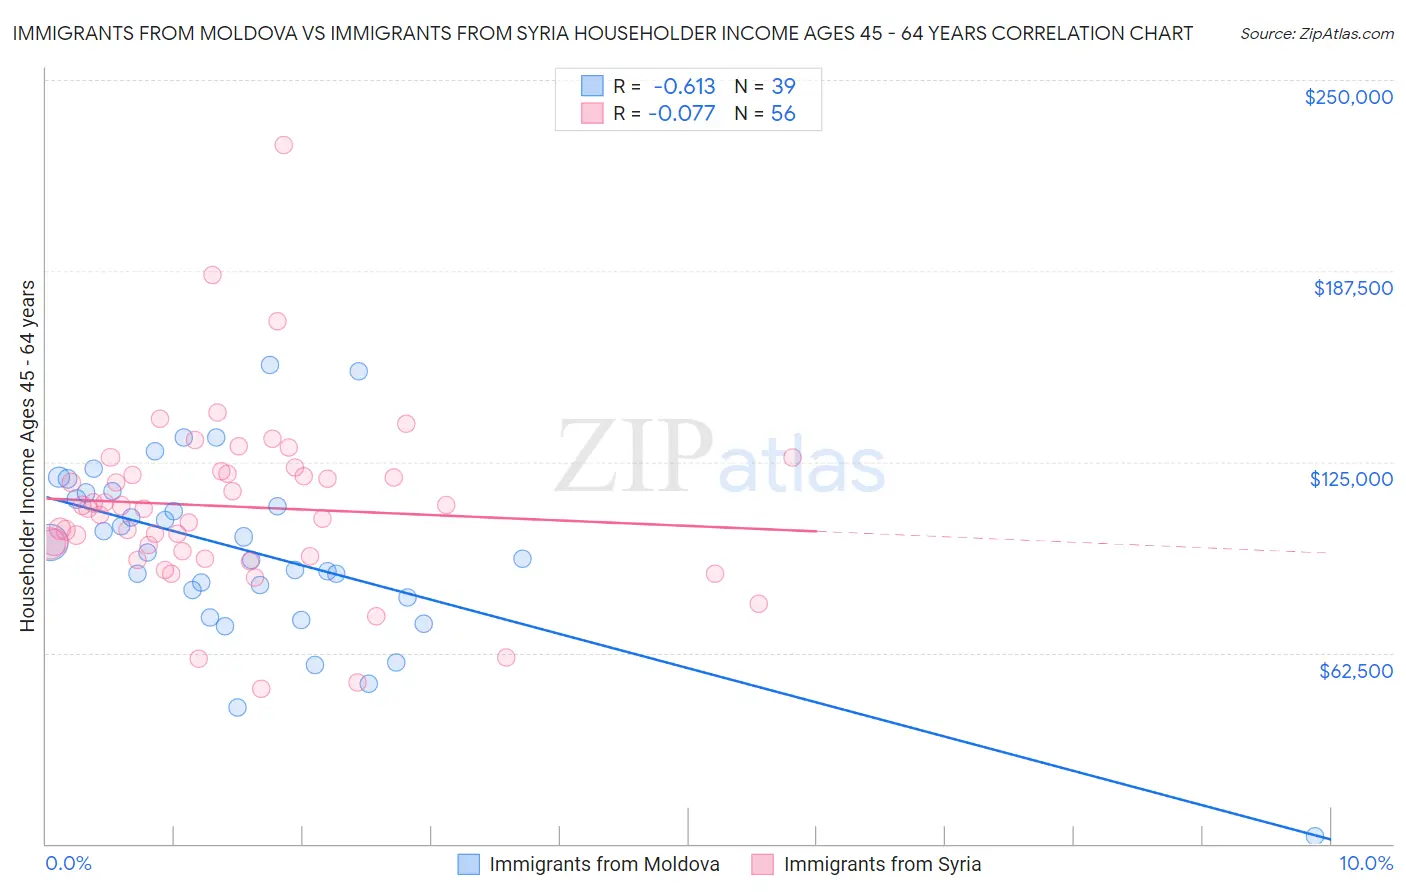
Immigrants from Moldova vs Immigrants from Syria Householder Income Ages 45 - 64 years Correlation Chart
The statistical analysis conducted on geographies consisting of 124,350,842 people shows a significant negative correlation between the proportion of Immigrants from Moldova and household income with householder between the ages 45 and 64 in the United States with a correlation coefficient (R) of -0.613 and weighted average of $107,357. Similarly, the statistical analysis conducted on geographies consisting of 174,068,241 people shows a slight negative correlation between the proportion of Immigrants from Syria and household income with householder between the ages 45 and 64 in the United States with a correlation coefficient (R) of -0.077 and weighted average of $104,858, a difference of 2.4%.
Householder Income Ages 45 - 64 years Correlation Summary
| Measurement | Immigrants from Moldova | Immigrants from Syria |
| Minimum | $2,499 | $50,774 |
| Maximum | $156,555 | $228,894 |
| Range | $154,056 | $178,120 |
| Mean | $95,532 | $110,346 |
| Median | $95,372 | $109,693 |
| Interquartile 25% (IQ1) | $80,570 | $94,783 |
| Interquartile 75% (IQ3) | $114,888 | $121,434 |
| Interquartile Range (IQR) | $34,318 | $26,651 |
| Standard Deviation (Sample) | $29,698 | $29,383 |
| Standard Deviation (Population) | $29,315 | $29,119 |
Similar Demographics by Householder Income Ages 45 - 64 years
Demographics Similar to Immigrants from Moldova by Householder Income Ages 45 - 64 years
In terms of householder income ages 45 - 64 years, the demographic groups most similar to Immigrants from Moldova are Immigrants from Kazakhstan ($107,378, a difference of 0.020%), Syrian ($107,207, a difference of 0.14%), Immigrants from Serbia ($107,569, a difference of 0.20%), Immigrants from Ukraine ($107,079, a difference of 0.26%), and Macedonian ($107,074, a difference of 0.26%).
| Demographics | Rating | Rank | Householder Income Ages 45 - 64 years |
| Immigrants | Hungary | 98.2 /100 | #95 | Exceptional $108,267 |
| Immigrants | Argentina | 98.2 /100 | #96 | Exceptional $108,264 |
| Northern Europeans | 97.8 /100 | #97 | Exceptional $107,870 |
| Immigrants | Southern Europe | 97.7 /100 | #98 | Exceptional $107,775 |
| Palestinians | 97.6 /100 | #99 | Exceptional $107,721 |
| Immigrants | Serbia | 97.4 /100 | #100 | Exceptional $107,569 |
| Immigrants | Kazakhstan | 97.2 /100 | #101 | Exceptional $107,378 |
| Immigrants | Moldova | 97.1 /100 | #102 | Exceptional $107,357 |
| Syrians | 96.9 /100 | #103 | Exceptional $107,207 |
| Immigrants | Ukraine | 96.7 /100 | #104 | Exceptional $107,079 |
| Macedonians | 96.7 /100 | #105 | Exceptional $107,074 |
| Armenians | 96.6 /100 | #106 | Exceptional $107,002 |
| Immigrants | Fiji | 96.5 /100 | #107 | Exceptional $106,952 |
| Zimbabweans | 96.3 /100 | #108 | Exceptional $106,849 |
| Chileans | 95.9 /100 | #109 | Exceptional $106,611 |
Demographics Similar to Immigrants from Syria by Householder Income Ages 45 - 64 years
In terms of householder income ages 45 - 64 years, the demographic groups most similar to Immigrants from Syria are Lebanese ($104,734, a difference of 0.12%), Immigrants from Zimbabwe ($104,992, a difference of 0.13%), Peruvian ($105,070, a difference of 0.20%), Native Hawaiian ($105,149, a difference of 0.28%), and Arab ($104,566, a difference of 0.28%).
| Demographics | Rating | Rank | Householder Income Ages 45 - 64 years |
| Immigrants | Northern Africa | 92.8 /100 | #124 | Exceptional $105,430 |
| Pakistanis | 92.4 /100 | #125 | Exceptional $105,317 |
| Portuguese | 92.4 /100 | #126 | Exceptional $105,309 |
| Immigrants | Saudi Arabia | 92.2 /100 | #127 | Exceptional $105,249 |
| Native Hawaiians | 91.8 /100 | #128 | Exceptional $105,149 |
| Peruvians | 91.5 /100 | #129 | Exceptional $105,070 |
| Immigrants | Zimbabwe | 91.2 /100 | #130 | Exceptional $104,992 |
| Immigrants | Syria | 90.7 /100 | #131 | Exceptional $104,858 |
| Lebanese | 90.1 /100 | #132 | Exceptional $104,734 |
| Arabs | 89.3 /100 | #133 | Excellent $104,566 |
| Canadians | 89.3 /100 | #134 | Excellent $104,560 |
| Brazilians | 88.6 /100 | #135 | Excellent $104,408 |
| Taiwanese | 87.4 /100 | #136 | Excellent $104,180 |
| Hungarians | 85.8 /100 | #137 | Excellent $103,913 |
| Ethiopians | 84.7 /100 | #138 | Excellent $103,736 |