Honduran vs Immigrants from Syria Householder Income Ages 45 - 64 years
COMPARE
Honduran
Immigrants from Syria
Householder Income Ages 45 - 64 years
Householder Income Ages 45 - 64 years Comparison
Hondurans
Immigrants from Syria
$84,079
HOUSEHOLDER INCOME AGES 45 - 64 YEARS
0.0/ 100
METRIC RATING
303rd/ 347
METRIC RANK
$104,858
HOUSEHOLDER INCOME AGES 45 - 64 YEARS
90.7/ 100
METRIC RATING
131st/ 347
METRIC RANK
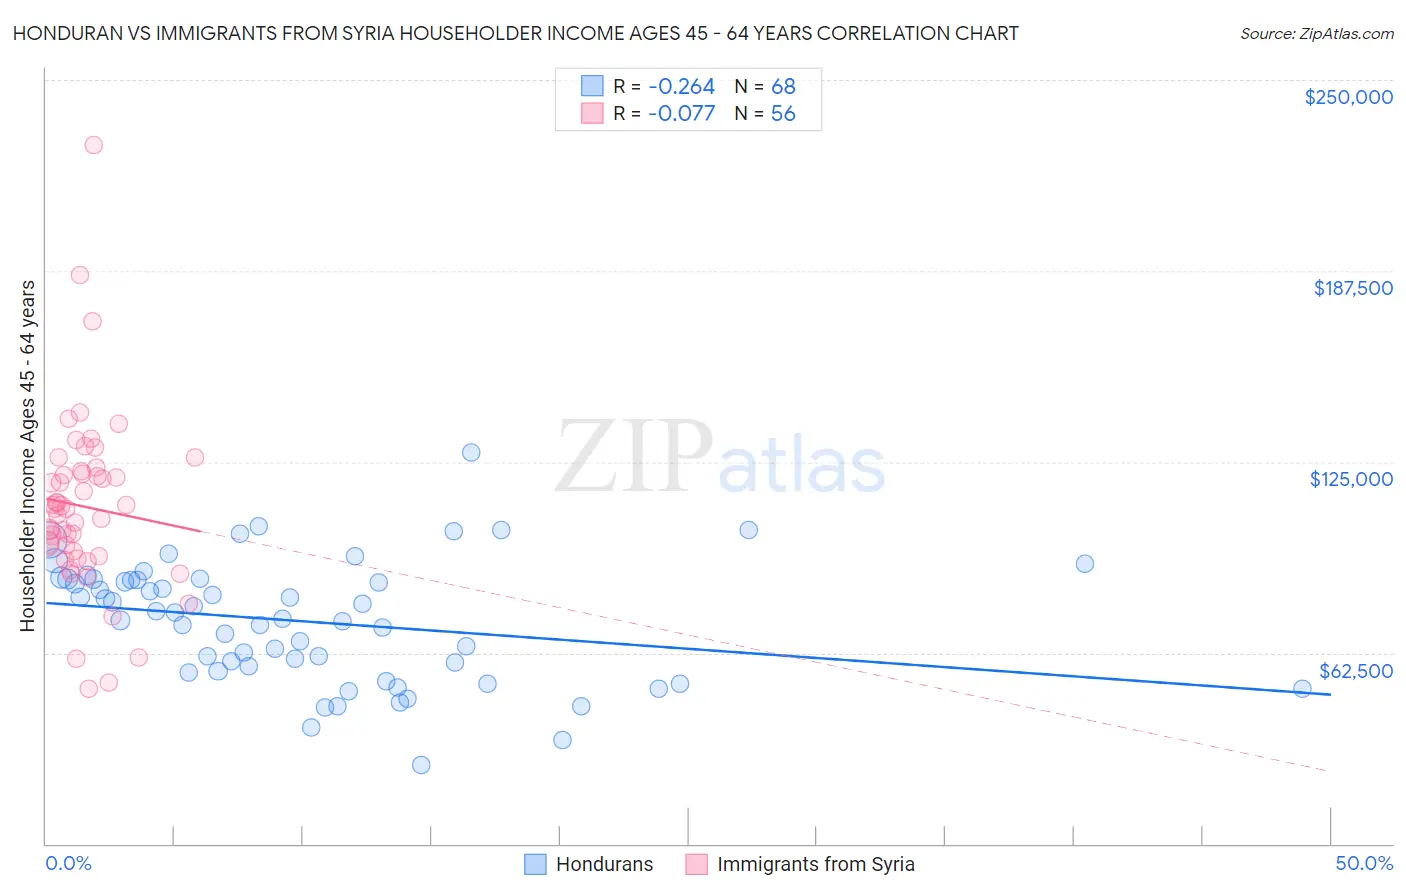
Honduran vs Immigrants from Syria Householder Income Ages 45 - 64 years Correlation Chart
The statistical analysis conducted on geographies consisting of 357,242,150 people shows a weak negative correlation between the proportion of Hondurans and household income with householder between the ages 45 and 64 in the United States with a correlation coefficient (R) of -0.264 and weighted average of $84,079. Similarly, the statistical analysis conducted on geographies consisting of 174,068,241 people shows a slight negative correlation between the proportion of Immigrants from Syria and household income with householder between the ages 45 and 64 in the United States with a correlation coefficient (R) of -0.077 and weighted average of $104,858, a difference of 24.7%.
Householder Income Ages 45 - 64 years Correlation Summary
| Measurement | Honduran | Immigrants from Syria |
| Minimum | $25,625 | $50,774 |
| Maximum | $128,207 | $228,894 |
| Range | $102,582 | $178,120 |
| Mean | $72,746 | $110,346 |
| Median | $74,692 | $109,693 |
| Interquartile 25% (IQ1) | $57,383 | $94,783 |
| Interquartile 75% (IQ3) | $86,481 | $121,434 |
| Interquartile Range (IQR) | $29,098 | $26,651 |
| Standard Deviation (Sample) | $19,858 | $29,383 |
| Standard Deviation (Population) | $19,711 | $29,119 |
Similar Demographics by Householder Income Ages 45 - 64 years
Demographics Similar to Hondurans by Householder Income Ages 45 - 64 years
In terms of householder income ages 45 - 64 years, the demographic groups most similar to Hondurans are Ottawa ($83,953, a difference of 0.15%), Chippewa ($83,943, a difference of 0.16%), Ute ($83,937, a difference of 0.17%), Haitian ($84,384, a difference of 0.36%), and Shoshone ($83,588, a difference of 0.59%).
| Demographics | Rating | Rank | Householder Income Ages 45 - 64 years |
| Immigrants | Zaire | 0.1 /100 | #296 | Tragic $85,207 |
| Fijians | 0.1 /100 | #297 | Tragic $85,187 |
| Africans | 0.0 /100 | #298 | Tragic $84,925 |
| Immigrants | Mexico | 0.0 /100 | #299 | Tragic $84,910 |
| Indonesians | 0.0 /100 | #300 | Tragic $84,890 |
| Potawatomi | 0.0 /100 | #301 | Tragic $84,613 |
| Haitians | 0.0 /100 | #302 | Tragic $84,384 |
| Hondurans | 0.0 /100 | #303 | Tragic $84,079 |
| Ottawa | 0.0 /100 | #304 | Tragic $83,953 |
| Chippewa | 0.0 /100 | #305 | Tragic $83,943 |
| Ute | 0.0 /100 | #306 | Tragic $83,937 |
| Shoshone | 0.0 /100 | #307 | Tragic $83,588 |
| Immigrants | Cabo Verde | 0.0 /100 | #308 | Tragic $83,542 |
| Immigrants | Dominica | 0.0 /100 | #309 | Tragic $83,311 |
| Immigrants | Haiti | 0.0 /100 | #310 | Tragic $83,257 |
Demographics Similar to Immigrants from Syria by Householder Income Ages 45 - 64 years
In terms of householder income ages 45 - 64 years, the demographic groups most similar to Immigrants from Syria are Lebanese ($104,734, a difference of 0.12%), Immigrants from Zimbabwe ($104,992, a difference of 0.13%), Peruvian ($105,070, a difference of 0.20%), Native Hawaiian ($105,149, a difference of 0.28%), and Arab ($104,566, a difference of 0.28%).
| Demographics | Rating | Rank | Householder Income Ages 45 - 64 years |
| Immigrants | Northern Africa | 92.8 /100 | #124 | Exceptional $105,430 |
| Pakistanis | 92.4 /100 | #125 | Exceptional $105,317 |
| Portuguese | 92.4 /100 | #126 | Exceptional $105,309 |
| Immigrants | Saudi Arabia | 92.2 /100 | #127 | Exceptional $105,249 |
| Native Hawaiians | 91.8 /100 | #128 | Exceptional $105,149 |
| Peruvians | 91.5 /100 | #129 | Exceptional $105,070 |
| Immigrants | Zimbabwe | 91.2 /100 | #130 | Exceptional $104,992 |
| Immigrants | Syria | 90.7 /100 | #131 | Exceptional $104,858 |
| Lebanese | 90.1 /100 | #132 | Exceptional $104,734 |
| Arabs | 89.3 /100 | #133 | Excellent $104,566 |
| Canadians | 89.3 /100 | #134 | Excellent $104,560 |
| Brazilians | 88.6 /100 | #135 | Excellent $104,408 |
| Taiwanese | 87.4 /100 | #136 | Excellent $104,180 |
| Hungarians | 85.8 /100 | #137 | Excellent $103,913 |
| Ethiopians | 84.7 /100 | #138 | Excellent $103,736 |