Immigrants from Turkey vs Yakama Householder Income Ages 45 - 64 years
COMPARE
Immigrants from Turkey
Yakama
Householder Income Ages 45 - 64 years
Householder Income Ages 45 - 64 years Comparison
Immigrants from Turkey
Yakama
$114,407
HOUSEHOLDER INCOME AGES 45 - 64 YEARS
99.9/ 100
METRIC RATING
39th/ 347
METRIC RANK
$86,992
HOUSEHOLDER INCOME AGES 45 - 64 YEARS
0.1/ 100
METRIC RATING
279th/ 347
METRIC RANK
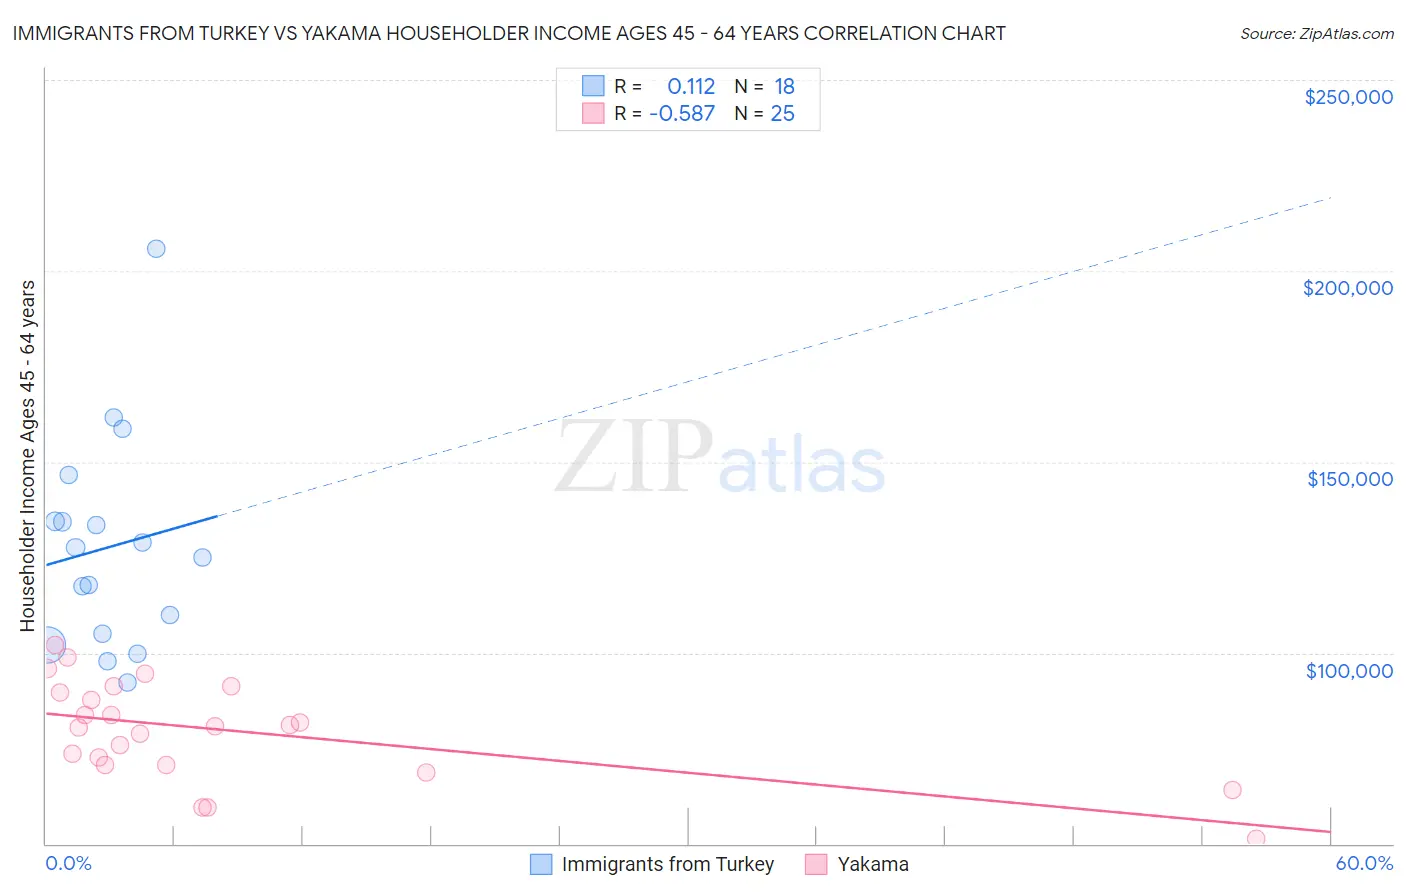
Immigrants from Turkey vs Yakama Householder Income Ages 45 - 64 years Correlation Chart
The statistical analysis conducted on geographies consisting of 222,848,183 people shows a poor positive correlation between the proportion of Immigrants from Turkey and household income with householder between the ages 45 and 64 in the United States with a correlation coefficient (R) of 0.112 and weighted average of $114,407. Similarly, the statistical analysis conducted on geographies consisting of 19,897,154 people shows a substantial negative correlation between the proportion of Yakama and household income with householder between the ages 45 and 64 in the United States with a correlation coefficient (R) of -0.587 and weighted average of $86,992, a difference of 31.5%.
Householder Income Ages 45 - 64 years Correlation Summary
| Measurement | Immigrants from Turkey | Yakama |
| Minimum | $92,363 | $51,250 |
| Maximum | $205,770 | $102,065 |
| Range | $113,407 | $50,815 |
| Mean | $127,654 | $79,495 |
| Median | $126,227 | $80,929 |
| Interquartile 25% (IQ1) | $104,873 | $70,556 |
| Interquartile 75% (IQ3) | $134,485 | $90,396 |
| Interquartile Range (IQR) | $29,612 | $19,840 |
| Standard Deviation (Sample) | $27,992 | $13,031 |
| Standard Deviation (Population) | $27,203 | $12,768 |
Similar Demographics by Householder Income Ages 45 - 64 years
Demographics Similar to Immigrants from Turkey by Householder Income Ages 45 - 64 years
In terms of householder income ages 45 - 64 years, the demographic groups most similar to Immigrants from Turkey are Immigrants from Pakistan ($114,434, a difference of 0.020%), Cambodian ($114,342, a difference of 0.060%), Immigrants from Lithuania ($114,336, a difference of 0.060%), Estonian ($114,220, a difference of 0.16%), and Israeli ($114,186, a difference of 0.19%).
| Demographics | Rating | Rank | Householder Income Ages 45 - 64 years |
| Russians | 100.0 /100 | #32 | Exceptional $116,328 |
| Chinese | 100.0 /100 | #33 | Exceptional $116,156 |
| Immigrants | Denmark | 100.0 /100 | #34 | Exceptional $116,000 |
| Latvians | 100.0 /100 | #35 | Exceptional $115,957 |
| Immigrants | Switzerland | 100.0 /100 | #36 | Exceptional $115,934 |
| Maltese | 99.9 /100 | #37 | Exceptional $114,754 |
| Immigrants | Pakistan | 99.9 /100 | #38 | Exceptional $114,434 |
| Immigrants | Turkey | 99.9 /100 | #39 | Exceptional $114,407 |
| Cambodians | 99.9 /100 | #40 | Exceptional $114,342 |
| Immigrants | Lithuania | 99.9 /100 | #41 | Exceptional $114,336 |
| Estonians | 99.9 /100 | #42 | Exceptional $114,220 |
| Israelis | 99.9 /100 | #43 | Exceptional $114,186 |
| Bulgarians | 99.9 /100 | #44 | Exceptional $113,883 |
| Immigrants | France | 99.9 /100 | #45 | Exceptional $113,680 |
| Immigrants | Greece | 99.9 /100 | #46 | Exceptional $113,548 |
Demographics Similar to Yakama by Householder Income Ages 45 - 64 years
In terms of householder income ages 45 - 64 years, the demographic groups most similar to Yakama are Immigrants from Somalia ($86,987, a difference of 0.010%), Immigrants from Jamaica ($87,035, a difference of 0.050%), Yaqui ($86,914, a difference of 0.090%), Senegalese ($86,897, a difference of 0.11%), and Mexican ($86,816, a difference of 0.20%).
| Demographics | Rating | Rank | Householder Income Ages 45 - 64 years |
| Cape Verdeans | 0.2 /100 | #272 | Tragic $87,580 |
| Spanish American Indians | 0.2 /100 | #273 | Tragic $87,561 |
| Iroquois | 0.1 /100 | #274 | Tragic $87,255 |
| Immigrants | Belize | 0.1 /100 | #275 | Tragic $87,229 |
| Immigrants | Latin America | 0.1 /100 | #276 | Tragic $87,219 |
| Cree | 0.1 /100 | #277 | Tragic $87,185 |
| Immigrants | Jamaica | 0.1 /100 | #278 | Tragic $87,035 |
| Yakama | 0.1 /100 | #279 | Tragic $86,992 |
| Immigrants | Somalia | 0.1 /100 | #280 | Tragic $86,987 |
| Yaqui | 0.1 /100 | #281 | Tragic $86,914 |
| Senegalese | 0.1 /100 | #282 | Tragic $86,897 |
| Mexicans | 0.1 /100 | #283 | Tragic $86,816 |
| Central American Indians | 0.1 /100 | #284 | Tragic $86,764 |
| Blackfeet | 0.1 /100 | #285 | Tragic $86,595 |
| Immigrants | Guatemala | 0.1 /100 | #286 | Tragic $86,573 |