Czechoslovakian vs Immigrants from Serbia Householder Income Ages 45 - 64 years
COMPARE
Czechoslovakian
Immigrants from Serbia
Householder Income Ages 45 - 64 years
Householder Income Ages 45 - 64 years Comparison
Czechoslovakians
Immigrants from Serbia
$101,387
HOUSEHOLDER INCOME AGES 45 - 64 YEARS
63.0/ 100
METRIC RATING
167th/ 347
METRIC RANK
$107,569
HOUSEHOLDER INCOME AGES 45 - 64 YEARS
97.4/ 100
METRIC RATING
100th/ 347
METRIC RANK
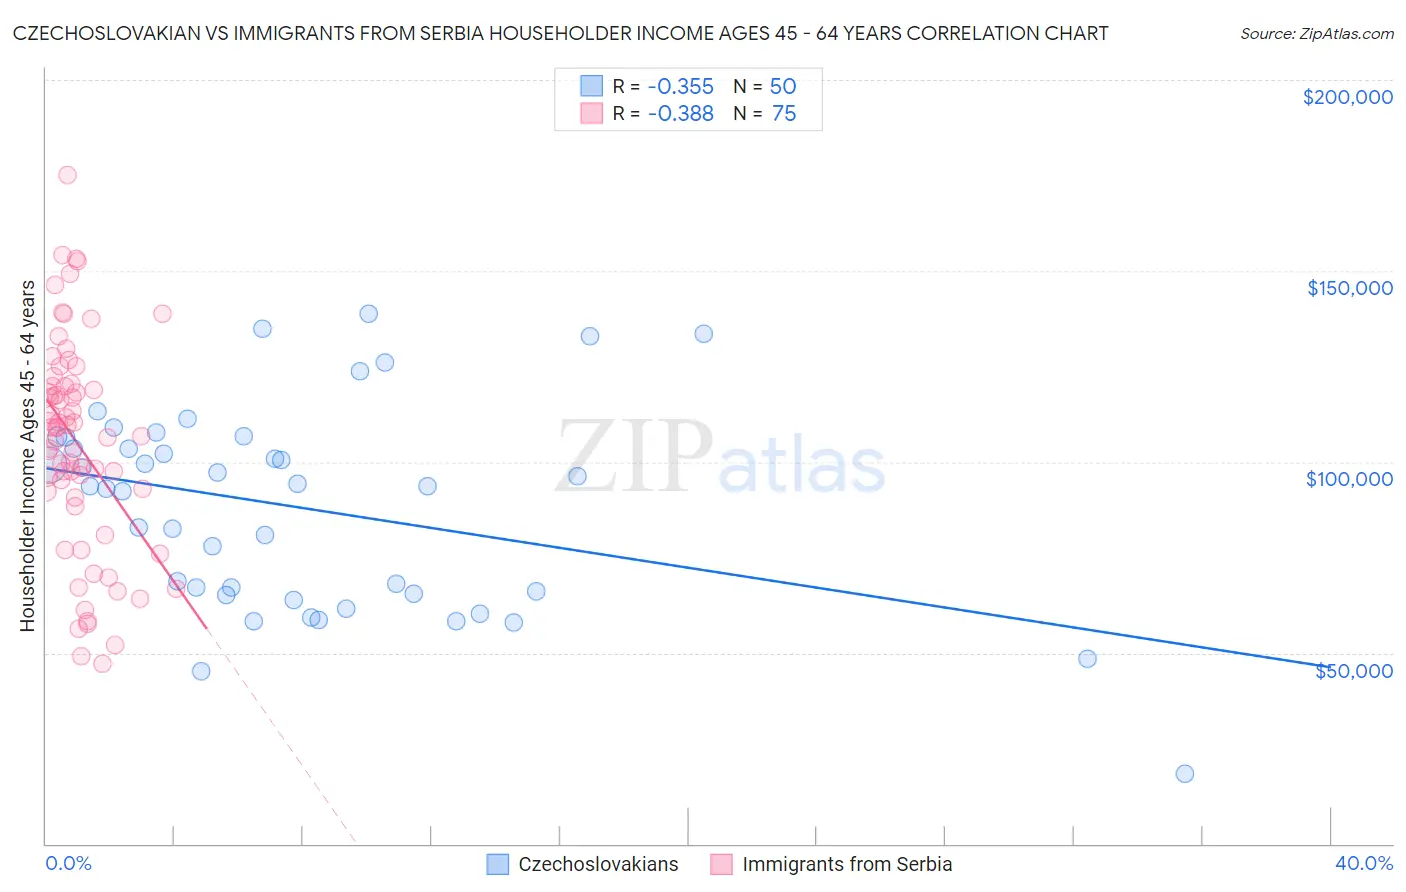
Czechoslovakian vs Immigrants from Serbia Householder Income Ages 45 - 64 years Correlation Chart
The statistical analysis conducted on geographies consisting of 368,168,264 people shows a mild negative correlation between the proportion of Czechoslovakians and household income with householder between the ages 45 and 64 in the United States with a correlation coefficient (R) of -0.355 and weighted average of $101,387. Similarly, the statistical analysis conducted on geographies consisting of 131,681,242 people shows a mild negative correlation between the proportion of Immigrants from Serbia and household income with householder between the ages 45 and 64 in the United States with a correlation coefficient (R) of -0.388 and weighted average of $107,569, a difference of 6.1%.
Householder Income Ages 45 - 64 years Correlation Summary
| Measurement | Czechoslovakian | Immigrants from Serbia |
| Minimum | $18,333 | $47,000 |
| Maximum | $138,929 | $175,247 |
| Range | $120,596 | $128,247 |
| Mean | $87,984 | $104,599 |
| Median | $93,579 | $108,917 |
| Interquartile 25% (IQ1) | $65,365 | $90,676 |
| Interquartile 75% (IQ3) | $106,355 | $119,792 |
| Interquartile Range (IQR) | $40,989 | $29,116 |
| Standard Deviation (Sample) | $26,471 | $27,672 |
| Standard Deviation (Population) | $26,205 | $27,487 |
Similar Demographics by Householder Income Ages 45 - 64 years
Demographics Similar to Czechoslovakians by Householder Income Ages 45 - 64 years
In terms of householder income ages 45 - 64 years, the demographic groups most similar to Czechoslovakians are Samoan ($101,580, a difference of 0.19%), South American Indian ($101,171, a difference of 0.21%), Guamanian/Chamorro ($101,170, a difference of 0.21%), Slovak ($101,029, a difference of 0.35%), and South American ($100,837, a difference of 0.54%).
| Demographics | Rating | Rank | Householder Income Ages 45 - 64 years |
| Icelanders | 72.5 /100 | #160 | Good $102,261 |
| Immigrants | Nepal | 71.8 /100 | #161 | Good $102,190 |
| Scottish | 71.1 /100 | #162 | Good $102,123 |
| English | 70.1 /100 | #163 | Good $102,021 |
| Immigrants | Morocco | 70.0 /100 | #164 | Good $102,015 |
| Immigrants | Albania | 69.4 /100 | #165 | Good $101,957 |
| Samoans | 65.3 /100 | #166 | Good $101,580 |
| Czechoslovakians | 63.0 /100 | #167 | Good $101,387 |
| South American Indians | 60.5 /100 | #168 | Good $101,171 |
| Guamanians/Chamorros | 60.5 /100 | #169 | Good $101,170 |
| Slovaks | 58.8 /100 | #170 | Average $101,029 |
| South Americans | 56.4 /100 | #171 | Average $100,837 |
| Immigrants | Uzbekistan | 52.5 /100 | #172 | Average $100,523 |
| Alsatians | 51.4 /100 | #173 | Average $100,435 |
| Welsh | 50.0 /100 | #174 | Average $100,322 |
Demographics Similar to Immigrants from Serbia by Householder Income Ages 45 - 64 years
In terms of householder income ages 45 - 64 years, the demographic groups most similar to Immigrants from Serbia are Palestinian ($107,721, a difference of 0.14%), Immigrants from Kazakhstan ($107,378, a difference of 0.18%), Immigrants from Southern Europe ($107,775, a difference of 0.19%), Immigrants from Moldova ($107,357, a difference of 0.20%), and Northern European ($107,870, a difference of 0.28%).
| Demographics | Rating | Rank | Householder Income Ages 45 - 64 years |
| Immigrants | Croatia | 98.2 /100 | #93 | Exceptional $108,304 |
| Sri Lankans | 98.2 /100 | #94 | Exceptional $108,270 |
| Immigrants | Hungary | 98.2 /100 | #95 | Exceptional $108,267 |
| Immigrants | Argentina | 98.2 /100 | #96 | Exceptional $108,264 |
| Northern Europeans | 97.8 /100 | #97 | Exceptional $107,870 |
| Immigrants | Southern Europe | 97.7 /100 | #98 | Exceptional $107,775 |
| Palestinians | 97.6 /100 | #99 | Exceptional $107,721 |
| Immigrants | Serbia | 97.4 /100 | #100 | Exceptional $107,569 |
| Immigrants | Kazakhstan | 97.2 /100 | #101 | Exceptional $107,378 |
| Immigrants | Moldova | 97.1 /100 | #102 | Exceptional $107,357 |
| Syrians | 96.9 /100 | #103 | Exceptional $107,207 |
| Immigrants | Ukraine | 96.7 /100 | #104 | Exceptional $107,079 |
| Macedonians | 96.7 /100 | #105 | Exceptional $107,074 |
| Armenians | 96.6 /100 | #106 | Exceptional $107,002 |
| Immigrants | Fiji | 96.5 /100 | #107 | Exceptional $106,952 |