Immigrants from South Eastern Asia vs Immigrants from Serbia Householder Income Ages 45 - 64 years
COMPARE
Immigrants from South Eastern Asia
Immigrants from Serbia
Householder Income Ages 45 - 64 years
Householder Income Ages 45 - 64 years Comparison
Immigrants from South Eastern Asia
Immigrants from Serbia
$106,109
HOUSEHOLDER INCOME AGES 45 - 64 YEARS
94.8/ 100
METRIC RATING
120th/ 347
METRIC RANK
$107,569
HOUSEHOLDER INCOME AGES 45 - 64 YEARS
97.4/ 100
METRIC RATING
100th/ 347
METRIC RANK
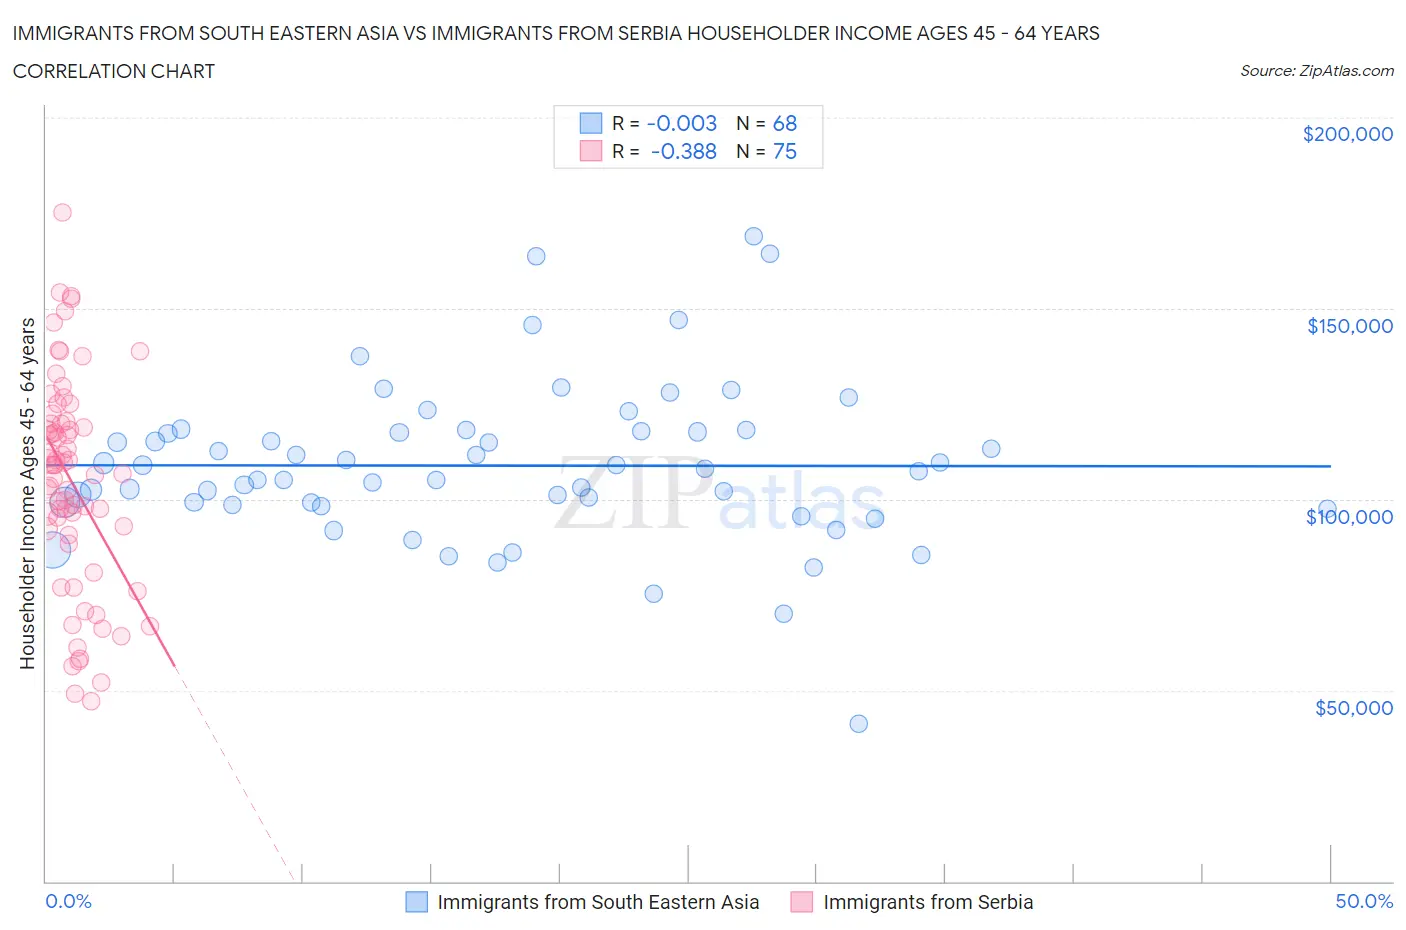
Immigrants from South Eastern Asia vs Immigrants from Serbia Householder Income Ages 45 - 64 years Correlation Chart
The statistical analysis conducted on geographies consisting of 511,033,304 people shows no correlation between the proportion of Immigrants from South Eastern Asia and household income with householder between the ages 45 and 64 in the United States with a correlation coefficient (R) of -0.003 and weighted average of $106,109. Similarly, the statistical analysis conducted on geographies consisting of 131,681,242 people shows a mild negative correlation between the proportion of Immigrants from Serbia and household income with householder between the ages 45 and 64 in the United States with a correlation coefficient (R) of -0.388 and weighted average of $107,569, a difference of 1.4%.
Householder Income Ages 45 - 64 years Correlation Summary
| Measurement | Immigrants from South Eastern Asia | Immigrants from Serbia |
| Minimum | $41,250 | $47,000 |
| Maximum | $168,774 | $175,247 |
| Range | $127,524 | $128,247 |
| Mean | $108,858 | $104,599 |
| Median | $107,753 | $108,917 |
| Interquartile 25% (IQ1) | $98,855 | $90,676 |
| Interquartile 75% (IQ3) | $117,791 | $119,792 |
| Interquartile Range (IQR) | $18,936 | $29,116 |
| Standard Deviation (Sample) | $20,977 | $27,672 |
| Standard Deviation (Population) | $20,822 | $27,487 |
Demographics Similar to Immigrants from South Eastern Asia and Immigrants from Serbia by Householder Income Ages 45 - 64 years
In terms of householder income ages 45 - 64 years, the demographic groups most similar to Immigrants from South Eastern Asia are Immigrants from Jordan ($106,164, a difference of 0.050%), Immigrants from Western Asia ($106,217, a difference of 0.10%), Albanian ($106,243, a difference of 0.13%), British ($106,264, a difference of 0.15%), and Immigrants from Kuwait ($106,285, a difference of 0.17%). Similarly, the demographic groups most similar to Immigrants from Serbia are Immigrants from Kazakhstan ($107,378, a difference of 0.18%), Immigrants from Moldova ($107,357, a difference of 0.20%), Syrian ($107,207, a difference of 0.34%), Immigrants from Ukraine ($107,079, a difference of 0.46%), and Macedonian ($107,074, a difference of 0.46%).
| Demographics | Rating | Rank | Householder Income Ages 45 - 64 years |
| Immigrants | Serbia | 97.4 /100 | #100 | Exceptional $107,569 |
| Immigrants | Kazakhstan | 97.2 /100 | #101 | Exceptional $107,378 |
| Immigrants | Moldova | 97.1 /100 | #102 | Exceptional $107,357 |
| Syrians | 96.9 /100 | #103 | Exceptional $107,207 |
| Immigrants | Ukraine | 96.7 /100 | #104 | Exceptional $107,079 |
| Macedonians | 96.7 /100 | #105 | Exceptional $107,074 |
| Armenians | 96.6 /100 | #106 | Exceptional $107,002 |
| Immigrants | Fiji | 96.5 /100 | #107 | Exceptional $106,952 |
| Zimbabweans | 96.3 /100 | #108 | Exceptional $106,849 |
| Chileans | 95.9 /100 | #109 | Exceptional $106,611 |
| Immigrants | Brazil | 95.6 /100 | #110 | Exceptional $106,470 |
| Immigrants | Vietnam | 95.5 /100 | #111 | Exceptional $106,417 |
| Swedes | 95.4 /100 | #112 | Exceptional $106,377 |
| Europeans | 95.4 /100 | #113 | Exceptional $106,367 |
| Immigrants | Poland | 95.3 /100 | #114 | Exceptional $106,319 |
| Immigrants | Kuwait | 95.2 /100 | #115 | Exceptional $106,285 |
| British | 95.2 /100 | #116 | Exceptional $106,264 |
| Albanians | 95.1 /100 | #117 | Exceptional $106,243 |
| Immigrants | Western Asia | 95.0 /100 | #118 | Exceptional $106,217 |
| Immigrants | Jordan | 94.9 /100 | #119 | Exceptional $106,164 |
| Immigrants | South Eastern Asia | 94.8 /100 | #120 | Exceptional $106,109 |