Portuguese vs Immigrants from Serbia Householder Income Ages 45 - 64 years
COMPARE
Portuguese
Immigrants from Serbia
Householder Income Ages 45 - 64 years
Householder Income Ages 45 - 64 years Comparison
Portuguese
Immigrants from Serbia
$105,309
HOUSEHOLDER INCOME AGES 45 - 64 YEARS
92.4/ 100
METRIC RATING
126th/ 347
METRIC RANK
$107,569
HOUSEHOLDER INCOME AGES 45 - 64 YEARS
97.4/ 100
METRIC RATING
100th/ 347
METRIC RANK
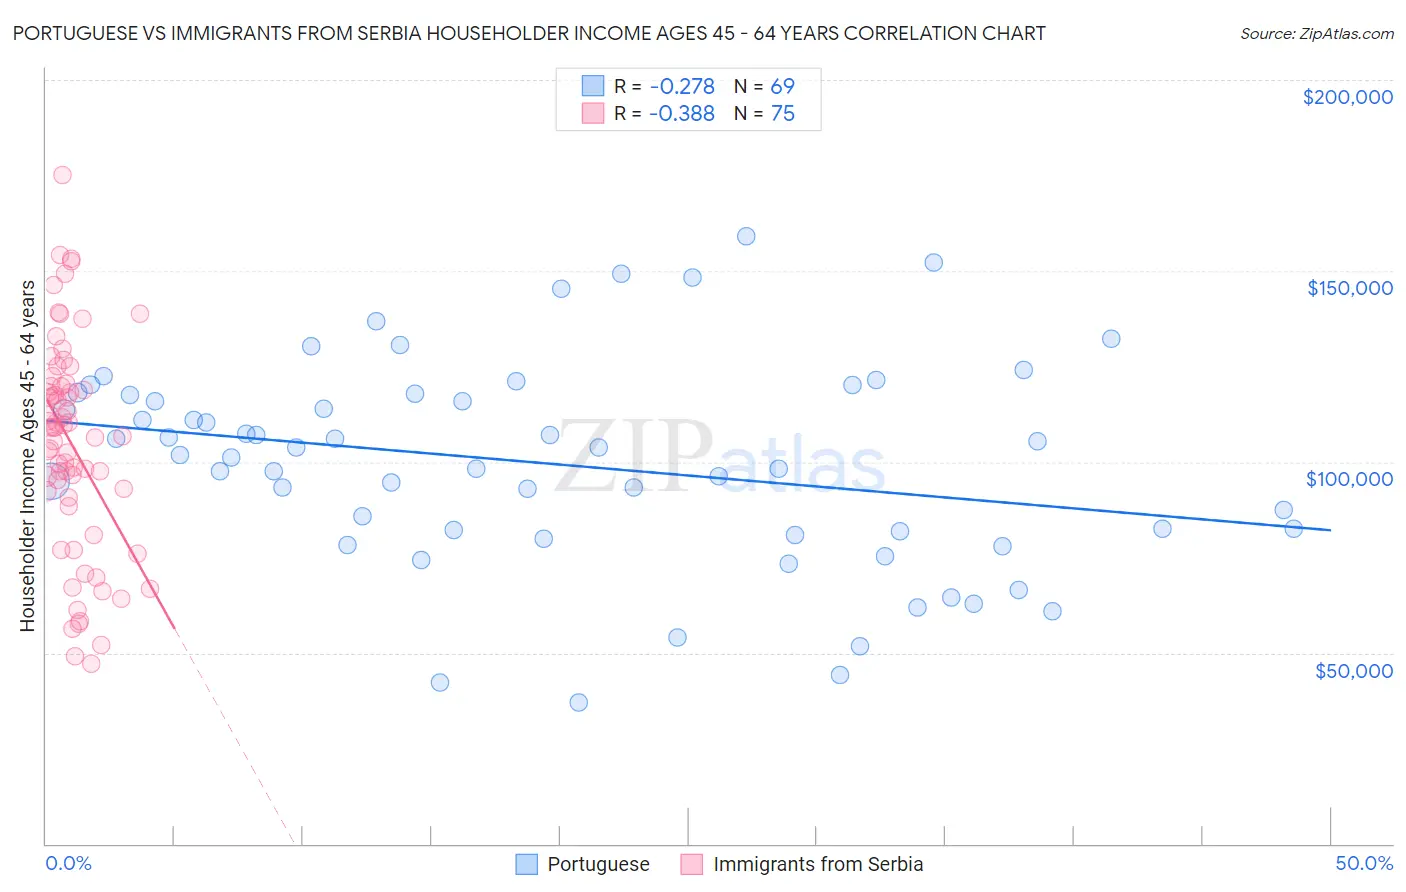
Portuguese vs Immigrants from Serbia Householder Income Ages 45 - 64 years Correlation Chart
The statistical analysis conducted on geographies consisting of 449,072,520 people shows a weak negative correlation between the proportion of Portuguese and household income with householder between the ages 45 and 64 in the United States with a correlation coefficient (R) of -0.278 and weighted average of $105,309. Similarly, the statistical analysis conducted on geographies consisting of 131,681,242 people shows a mild negative correlation between the proportion of Immigrants from Serbia and household income with householder between the ages 45 and 64 in the United States with a correlation coefficient (R) of -0.388 and weighted average of $107,569, a difference of 2.1%.
Householder Income Ages 45 - 64 years Correlation Summary
| Measurement | Portuguese | Immigrants from Serbia |
| Minimum | $36,861 | $47,000 |
| Maximum | $159,085 | $175,247 |
| Range | $122,224 | $128,247 |
| Mean | $99,397 | $104,599 |
| Median | $101,779 | $108,917 |
| Interquartile 25% (IQ1) | $81,364 | $90,676 |
| Interquartile 75% (IQ3) | $117,677 | $119,792 |
| Interquartile Range (IQR) | $36,312 | $29,116 |
| Standard Deviation (Sample) | $27,067 | $27,672 |
| Standard Deviation (Population) | $26,870 | $27,487 |
Similar Demographics by Householder Income Ages 45 - 64 years
Demographics Similar to Portuguese by Householder Income Ages 45 - 64 years
In terms of householder income ages 45 - 64 years, the demographic groups most similar to Portuguese are Pakistani ($105,317, a difference of 0.010%), Immigrants from Saudi Arabia ($105,249, a difference of 0.060%), Immigrants from Northern Africa ($105,430, a difference of 0.12%), Native Hawaiian ($105,149, a difference of 0.15%), and Peruvian ($105,070, a difference of 0.23%).
| Demographics | Rating | Rank | Householder Income Ages 45 - 64 years |
| Immigrants | Jordan | 94.9 /100 | #119 | Exceptional $106,164 |
| Immigrants | South Eastern Asia | 94.8 /100 | #120 | Exceptional $106,109 |
| Poles | 94.4 /100 | #121 | Exceptional $105,952 |
| Immigrants | North Macedonia | 94.2 /100 | #122 | Exceptional $105,892 |
| Danes | 93.4 /100 | #123 | Exceptional $105,619 |
| Immigrants | Northern Africa | 92.8 /100 | #124 | Exceptional $105,430 |
| Pakistanis | 92.4 /100 | #125 | Exceptional $105,317 |
| Portuguese | 92.4 /100 | #126 | Exceptional $105,309 |
| Immigrants | Saudi Arabia | 92.2 /100 | #127 | Exceptional $105,249 |
| Native Hawaiians | 91.8 /100 | #128 | Exceptional $105,149 |
| Peruvians | 91.5 /100 | #129 | Exceptional $105,070 |
| Immigrants | Zimbabwe | 91.2 /100 | #130 | Exceptional $104,992 |
| Immigrants | Syria | 90.7 /100 | #131 | Exceptional $104,858 |
| Lebanese | 90.1 /100 | #132 | Exceptional $104,734 |
| Arabs | 89.3 /100 | #133 | Excellent $104,566 |
Demographics Similar to Immigrants from Serbia by Householder Income Ages 45 - 64 years
In terms of householder income ages 45 - 64 years, the demographic groups most similar to Immigrants from Serbia are Palestinian ($107,721, a difference of 0.14%), Immigrants from Kazakhstan ($107,378, a difference of 0.18%), Immigrants from Southern Europe ($107,775, a difference of 0.19%), Immigrants from Moldova ($107,357, a difference of 0.20%), and Northern European ($107,870, a difference of 0.28%).
| Demographics | Rating | Rank | Householder Income Ages 45 - 64 years |
| Immigrants | Croatia | 98.2 /100 | #93 | Exceptional $108,304 |
| Sri Lankans | 98.2 /100 | #94 | Exceptional $108,270 |
| Immigrants | Hungary | 98.2 /100 | #95 | Exceptional $108,267 |
| Immigrants | Argentina | 98.2 /100 | #96 | Exceptional $108,264 |
| Northern Europeans | 97.8 /100 | #97 | Exceptional $107,870 |
| Immigrants | Southern Europe | 97.7 /100 | #98 | Exceptional $107,775 |
| Palestinians | 97.6 /100 | #99 | Exceptional $107,721 |
| Immigrants | Serbia | 97.4 /100 | #100 | Exceptional $107,569 |
| Immigrants | Kazakhstan | 97.2 /100 | #101 | Exceptional $107,378 |
| Immigrants | Moldova | 97.1 /100 | #102 | Exceptional $107,357 |
| Syrians | 96.9 /100 | #103 | Exceptional $107,207 |
| Immigrants | Ukraine | 96.7 /100 | #104 | Exceptional $107,079 |
| Macedonians | 96.7 /100 | #105 | Exceptional $107,074 |
| Armenians | 96.6 /100 | #106 | Exceptional $107,002 |
| Immigrants | Fiji | 96.5 /100 | #107 | Exceptional $106,952 |