Immigrants from Trinidad and Tobago vs Tlingit-Haida Cognitive Disability
COMPARE
Immigrants from Trinidad and Tobago
Tlingit-Haida
Cognitive Disability
Cognitive Disability Comparison
Immigrants from Trinidad and Tobago
Tlingit-Haida
17.6%
COGNITIVE DISABILITY
8.7/ 100
METRIC RATING
209th/ 347
METRIC RANK
17.2%
COGNITIVE DISABILITY
59.4/ 100
METRIC RATING
171st/ 347
METRIC RANK
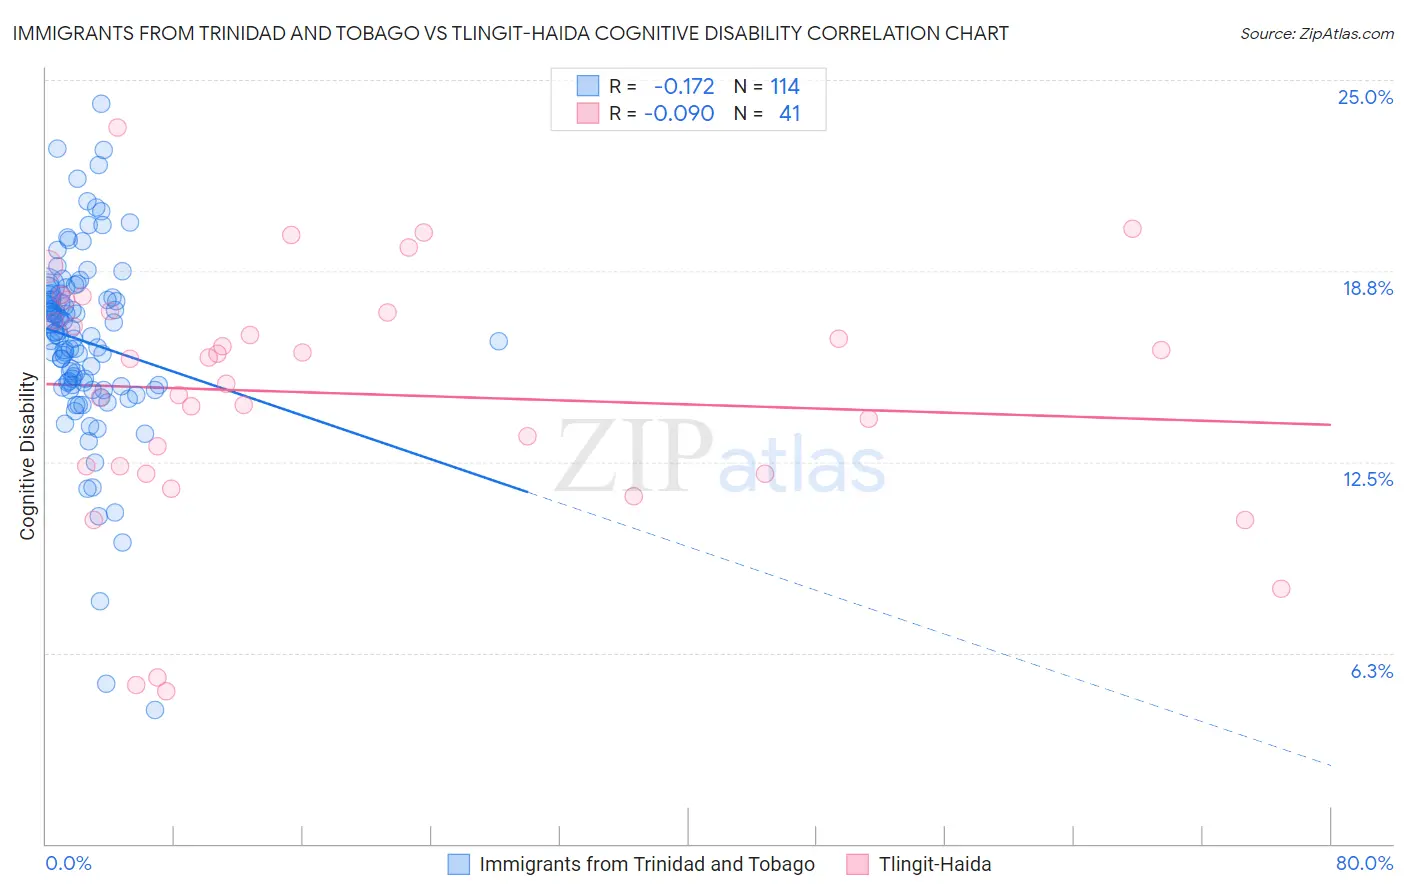
Immigrants from Trinidad and Tobago vs Tlingit-Haida Cognitive Disability Correlation Chart
The statistical analysis conducted on geographies consisting of 223,500,397 people shows a poor negative correlation between the proportion of Immigrants from Trinidad and Tobago and percentage of population with cognitive disability in the United States with a correlation coefficient (R) of -0.172 and weighted average of 17.6%. Similarly, the statistical analysis conducted on geographies consisting of 60,855,402 people shows a slight negative correlation between the proportion of Tlingit-Haida and percentage of population with cognitive disability in the United States with a correlation coefficient (R) of -0.090 and weighted average of 17.2%, a difference of 1.9%.
Cognitive Disability Correlation Summary
| Measurement | Immigrants from Trinidad and Tobago | Tlingit-Haida |
| Minimum | 4.4% | 5.0% |
| Maximum | 24.2% | 23.4% |
| Range | 19.8% | 18.4% |
| Mean | 16.4% | 14.7% |
| Median | 16.7% | 15.9% |
| Interquartile 25% (IQ1) | 15.0% | 12.2% |
| Interquartile 75% (IQ3) | 17.9% | 17.4% |
| Interquartile Range (IQR) | 2.9% | 5.2% |
| Standard Deviation (Sample) | 3.0% | 4.1% |
| Standard Deviation (Population) | 3.0% | 4.0% |
Similar Demographics by Cognitive Disability
Demographics Similar to Immigrants from Trinidad and Tobago by Cognitive Disability
In terms of cognitive disability, the demographic groups most similar to Immigrants from Trinidad and Tobago are Immigrants from Jamaica (17.6%, a difference of 0.020%), Immigrants from Cameroon (17.6%, a difference of 0.050%), Immigrants from Latin America (17.6%, a difference of 0.080%), Taiwanese (17.6%, a difference of 0.090%), and Alaska Native (17.5%, a difference of 0.13%).
| Demographics | Rating | Rank | Cognitive Disability |
| Immigrants | Morocco | 12.0 /100 | #202 | Poor 17.5% |
| Immigrants | Caribbean | 11.0 /100 | #203 | Poor 17.5% |
| Immigrants | Zimbabwe | 11.0 /100 | #204 | Poor 17.5% |
| Puget Sound Salish | 10.9 /100 | #205 | Poor 17.5% |
| Alaska Natives | 10.4 /100 | #206 | Poor 17.5% |
| Immigrants | Latin America | 9.7 /100 | #207 | Tragic 17.6% |
| Immigrants | Cameroon | 9.3 /100 | #208 | Tragic 17.6% |
| Immigrants | Trinidad and Tobago | 8.7 /100 | #209 | Tragic 17.6% |
| Immigrants | Jamaica | 8.5 /100 | #210 | Tragic 17.6% |
| Taiwanese | 7.7 /100 | #211 | Tragic 17.6% |
| Immigrants | Oceania | 7.3 /100 | #212 | Tragic 17.6% |
| Hawaiians | 7.2 /100 | #213 | Tragic 17.6% |
| Immigrants | El Salvador | 7.0 /100 | #214 | Tragic 17.6% |
| Alaskan Athabascans | 6.9 /100 | #215 | Tragic 17.6% |
| Okinawans | 6.8 /100 | #216 | Tragic 17.6% |
Demographics Similar to Tlingit-Haida by Cognitive Disability
In terms of cognitive disability, the demographic groups most similar to Tlingit-Haida are Ecuadorian (17.2%, a difference of 0.0%), Immigrants from Portugal (17.2%, a difference of 0.070%), Immigrants from Turkey (17.2%, a difference of 0.080%), Immigrants (17.2%, a difference of 0.090%), and Immigrants from Syria (17.2%, a difference of 0.12%).
| Demographics | Rating | Rank | Cognitive Disability |
| Armenians | 70.1 /100 | #164 | Good 17.2% |
| Immigrants | Albania | 64.9 /100 | #165 | Good 17.2% |
| Immigrants | Ecuador | 64.4 /100 | #166 | Good 17.2% |
| Immigrants | Syria | 63.5 /100 | #167 | Good 17.2% |
| Immigrants | Immigrants | 62.5 /100 | #168 | Good 17.2% |
| Immigrants | Portugal | 61.8 /100 | #169 | Good 17.2% |
| Ecuadorians | 59.6 /100 | #170 | Average 17.2% |
| Tlingit-Haida | 59.4 /100 | #171 | Average 17.2% |
| Immigrants | Turkey | 56.7 /100 | #172 | Average 17.2% |
| Immigrants | Northern Africa | 50.2 /100 | #173 | Average 17.3% |
| Laotians | 50.0 /100 | #174 | Average 17.3% |
| Tsimshian | 49.8 /100 | #175 | Average 17.3% |
| Shoshone | 49.2 /100 | #176 | Average 17.3% |
| Ute | 49.1 /100 | #177 | Average 17.3% |
| Spanish | 48.9 /100 | #178 | Average 17.3% |