Immigrants from Trinidad and Tobago vs Tlingit-Haida 5th Grade
COMPARE
Immigrants from Trinidad and Tobago
Tlingit-Haida
5th Grade
5th Grade Comparison
Immigrants from Trinidad and Tobago
Tlingit-Haida
96.6%
5TH GRADE
0.1/ 100
METRIC RATING
284th/ 347
METRIC RANK
98.3%
5TH GRADE
100.0/ 100
METRIC RATING
13th/ 347
METRIC RANK
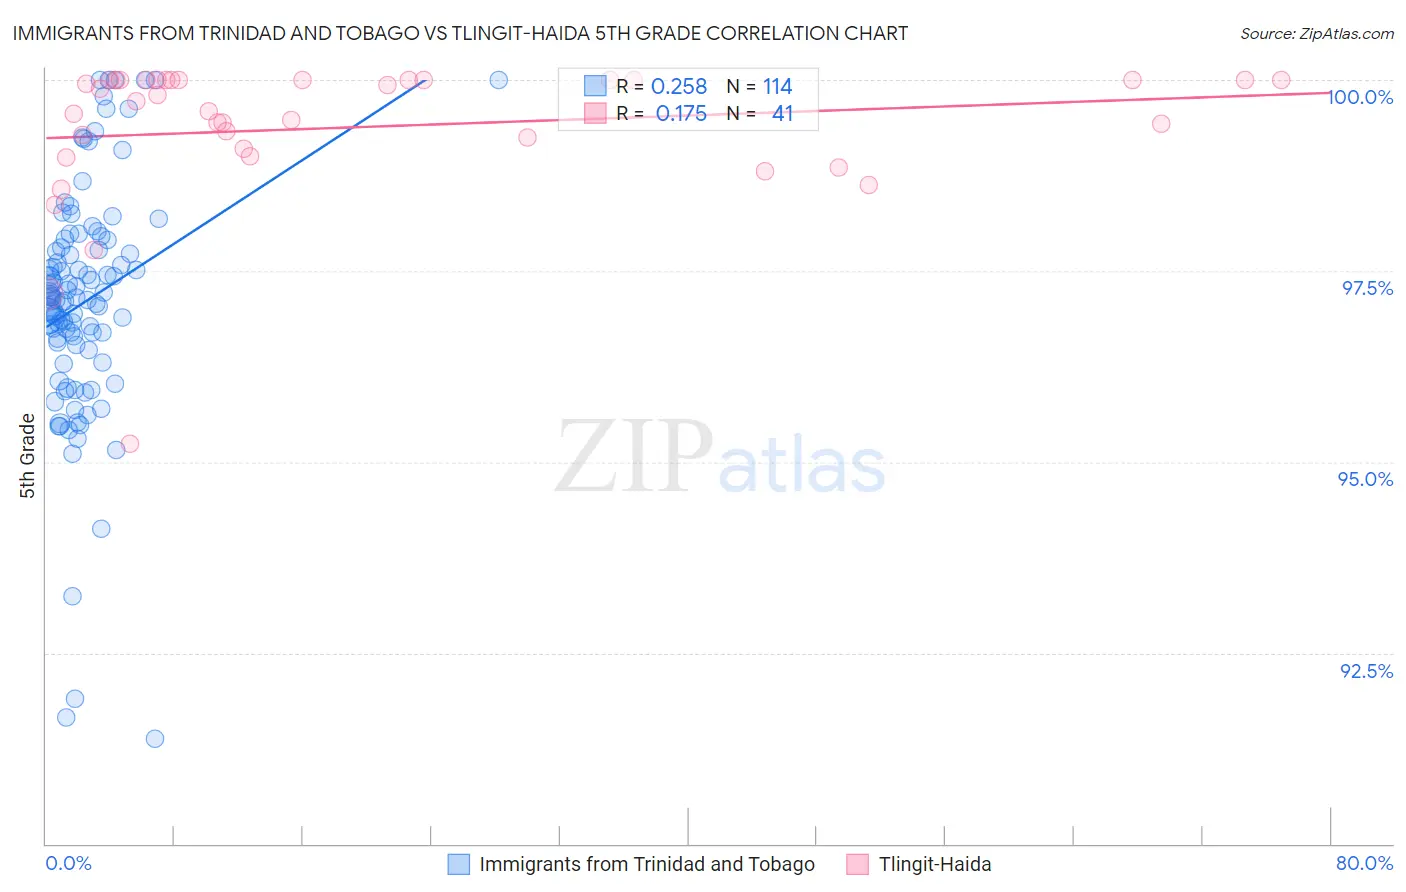
Immigrants from Trinidad and Tobago vs Tlingit-Haida 5th Grade Correlation Chart
The statistical analysis conducted on geographies consisting of 223,526,834 people shows a weak positive correlation between the proportion of Immigrants from Trinidad and Tobago and percentage of population with at least 5th grade education in the United States with a correlation coefficient (R) of 0.258 and weighted average of 96.6%. Similarly, the statistical analysis conducted on geographies consisting of 60,865,648 people shows a poor positive correlation between the proportion of Tlingit-Haida and percentage of population with at least 5th grade education in the United States with a correlation coefficient (R) of 0.175 and weighted average of 98.3%, a difference of 1.7%.
5th Grade Correlation Summary
| Measurement | Immigrants from Trinidad and Tobago | Tlingit-Haida |
| Minimum | 91.4% | 95.2% |
| Maximum | 100.0% | 100.0% |
| Range | 8.6% | 4.8% |
| Mean | 97.1% | 99.4% |
| Median | 97.1% | 99.7% |
| Interquartile 25% (IQ1) | 96.5% | 99.1% |
| Interquartile 75% (IQ3) | 97.8% | 100.0% |
| Interquartile Range (IQR) | 1.3% | 0.95% |
| Standard Deviation (Sample) | 1.6% | 0.94% |
| Standard Deviation (Population) | 1.6% | 0.93% |
Similar Demographics by 5th Grade
Demographics Similar to Immigrants from Trinidad and Tobago by 5th Grade
In terms of 5th grade, the demographic groups most similar to Immigrants from Trinidad and Tobago are Fijian (96.6%, a difference of 0.0%), Immigrants from Western Africa (96.6%, a difference of 0.010%), Houma (96.6%, a difference of 0.010%), Barbadian (96.6%, a difference of 0.010%), and Immigrants from St. Vincent and the Grenadines (96.6%, a difference of 0.010%).
| Demographics | Rating | Rank | 5th Grade |
| Immigrants | Bolivia | 0.1 /100 | #277 | Tragic 96.6% |
| Immigrants | Ghana | 0.1 /100 | #278 | Tragic 96.6% |
| Immigrants | Philippines | 0.1 /100 | #279 | Tragic 96.6% |
| Immigrants | Western Africa | 0.1 /100 | #280 | Tragic 96.6% |
| Houma | 0.1 /100 | #281 | Tragic 96.6% |
| Barbadians | 0.1 /100 | #282 | Tragic 96.6% |
| Fijians | 0.1 /100 | #283 | Tragic 96.6% |
| Immigrants | Trinidad and Tobago | 0.1 /100 | #284 | Tragic 96.6% |
| Immigrants | St. Vincent and the Grenadines | 0.1 /100 | #285 | Tragic 96.6% |
| Immigrants | Thailand | 0.1 /100 | #286 | Tragic 96.6% |
| Immigrants | Afghanistan | 0.1 /100 | #287 | Tragic 96.6% |
| Immigrants | Barbados | 0.0 /100 | #288 | Tragic 96.6% |
| Immigrants | West Indies | 0.0 /100 | #289 | Tragic 96.5% |
| British West Indians | 0.0 /100 | #290 | Tragic 96.5% |
| Malaysians | 0.0 /100 | #291 | Tragic 96.5% |
Demographics Similar to Tlingit-Haida by 5th Grade
In terms of 5th grade, the demographic groups most similar to Tlingit-Haida are Carpatho Rusyn (98.3%, a difference of 0.010%), Dutch (98.3%, a difference of 0.010%), Alaskan Athabascan (98.3%, a difference of 0.020%), Scottish (98.3%, a difference of 0.020%), and Swedish (98.3%, a difference of 0.030%).
| Demographics | Rating | Rank | 5th Grade |
| Germans | 100.0 /100 | #6 | Exceptional 98.4% |
| Inupiat | 100.0 /100 | #7 | Exceptional 98.4% |
| Slovenes | 100.0 /100 | #8 | Exceptional 98.3% |
| Swedes | 100.0 /100 | #9 | Exceptional 98.3% |
| English | 100.0 /100 | #10 | Exceptional 98.3% |
| Alaskan Athabascans | 100.0 /100 | #11 | Exceptional 98.3% |
| Carpatho Rusyns | 100.0 /100 | #12 | Exceptional 98.3% |
| Tlingit-Haida | 100.0 /100 | #13 | Exceptional 98.3% |
| Dutch | 100.0 /100 | #14 | Exceptional 98.3% |
| Scottish | 100.0 /100 | #15 | Exceptional 98.3% |
| Poles | 100.0 /100 | #16 | Exceptional 98.3% |
| Irish | 100.0 /100 | #17 | Exceptional 98.3% |
| Pennsylvania Germans | 100.0 /100 | #18 | Exceptional 98.3% |
| Finns | 100.0 /100 | #19 | Exceptional 98.2% |
| Lithuanians | 100.0 /100 | #20 | Exceptional 98.2% |