Immigrants from Thailand vs Iraqi 8th Grade
COMPARE
Immigrants from Thailand
Iraqi
8th Grade
8th Grade Comparison
Immigrants from Thailand
Iraqis
94.8%
8TH GRADE
0.2/ 100
METRIC RATING
269th/ 347
METRIC RANK
95.7%
8TH GRADE
40.5/ 100
METRIC RATING
180th/ 347
METRIC RANK
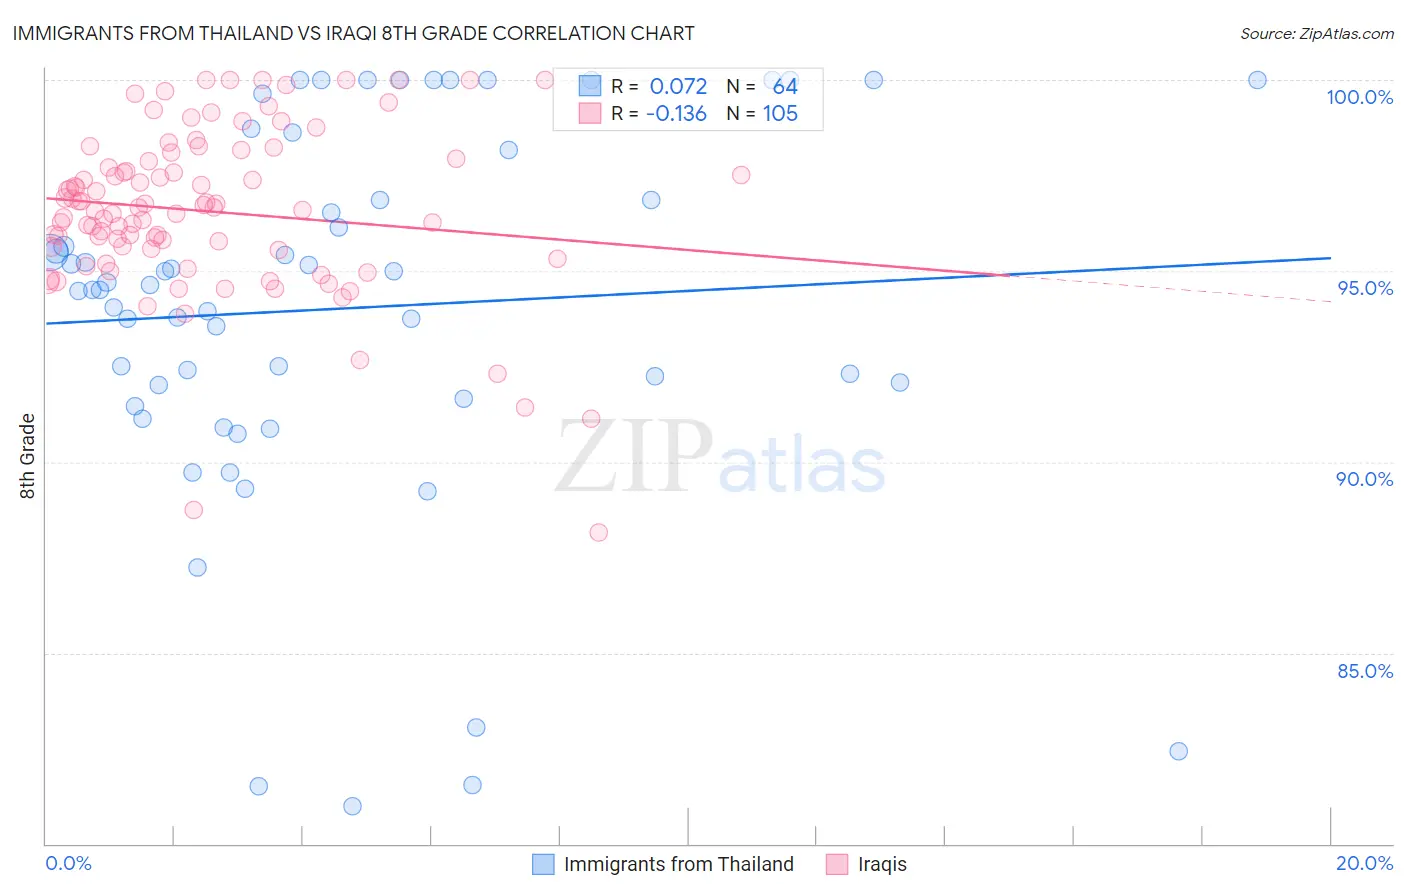
Immigrants from Thailand vs Iraqi 8th Grade Correlation Chart
The statistical analysis conducted on geographies consisting of 317,022,868 people shows a slight positive correlation between the proportion of Immigrants from Thailand and percentage of population with at least 8th grade education in the United States with a correlation coefficient (R) of 0.072 and weighted average of 94.8%. Similarly, the statistical analysis conducted on geographies consisting of 170,614,457 people shows a poor negative correlation between the proportion of Iraqis and percentage of population with at least 8th grade education in the United States with a correlation coefficient (R) of -0.136 and weighted average of 95.7%, a difference of 0.93%.
8th Grade Correlation Summary
| Measurement | Immigrants from Thailand | Iraqi |
| Minimum | 81.0% | 88.2% |
| Maximum | 100.0% | 100.0% |
| Range | 19.0% | 11.8% |
| Mean | 94.0% | 96.6% |
| Median | 94.6% | 96.7% |
| Interquartile 25% (IQ1) | 91.8% | 95.6% |
| Interquartile 75% (IQ3) | 97.5% | 97.9% |
| Interquartile Range (IQR) | 5.7% | 2.3% |
| Standard Deviation (Sample) | 4.9% | 2.2% |
| Standard Deviation (Population) | 4.8% | 2.2% |
Similar Demographics by 8th Grade
Demographics Similar to Immigrants from Thailand by 8th Grade
In terms of 8th grade, the demographic groups most similar to Immigrants from Thailand are Immigrants from Ghana (94.8%, a difference of 0.020%), Immigrants from Uruguay (94.8%, a difference of 0.020%), Immigrants from Uzbekistan (94.8%, a difference of 0.020%), Immigrants from Afghanistan (94.8%, a difference of 0.020%), and West Indian (94.8%, a difference of 0.040%).
| Demographics | Rating | Rank | 8th Grade |
| Immigrants | Nigeria | 0.4 /100 | #262 | Tragic 94.9% |
| Immigrants | Hong Kong | 0.4 /100 | #263 | Tragic 94.9% |
| South Americans | 0.4 /100 | #264 | Tragic 94.9% |
| Yuman | 0.4 /100 | #265 | Tragic 94.9% |
| West Indians | 0.3 /100 | #266 | Tragic 94.8% |
| Immigrants | Ghana | 0.3 /100 | #267 | Tragic 94.8% |
| Immigrants | Uruguay | 0.3 /100 | #268 | Tragic 94.8% |
| Immigrants | Thailand | 0.2 /100 | #269 | Tragic 94.8% |
| Immigrants | Uzbekistan | 0.2 /100 | #270 | Tragic 94.8% |
| Immigrants | Afghanistan | 0.2 /100 | #271 | Tragic 94.8% |
| Immigrants | South America | 0.2 /100 | #272 | Tragic 94.8% |
| Immigrants | Western Africa | 0.2 /100 | #273 | Tragic 94.8% |
| Trinidadians and Tobagonians | 0.2 /100 | #274 | Tragic 94.7% |
| Immigrants | Colombia | 0.2 /100 | #275 | Tragic 94.7% |
| Peruvians | 0.1 /100 | #276 | Tragic 94.7% |
Demographics Similar to Iraqis by 8th Grade
In terms of 8th grade, the demographic groups most similar to Iraqis are Immigrants from Spain (95.7%, a difference of 0.010%), Immigrants from Egypt (95.7%, a difference of 0.020%), Immigrants from Brazil (95.7%, a difference of 0.030%), Immigrants from Iraq (95.6%, a difference of 0.030%), and Immigrants from Uganda (95.6%, a difference of 0.030%).
| Demographics | Rating | Rank | 8th Grade |
| Mongolians | 53.0 /100 | #173 | Average 95.8% |
| Chileans | 50.0 /100 | #174 | Average 95.7% |
| Immigrants | Albania | 49.6 /100 | #175 | Average 95.7% |
| Pakistanis | 48.8 /100 | #176 | Average 95.7% |
| Marshallese | 47.6 /100 | #177 | Average 95.7% |
| Venezuelans | 47.5 /100 | #178 | Average 95.7% |
| Immigrants | Brazil | 45.4 /100 | #179 | Average 95.7% |
| Iraqis | 40.5 /100 | #180 | Average 95.7% |
| Immigrants | Spain | 38.7 /100 | #181 | Fair 95.7% |
| Immigrants | Egypt | 37.9 /100 | #182 | Fair 95.7% |
| Immigrants | Iraq | 36.2 /100 | #183 | Fair 95.6% |
| Immigrants | Uganda | 36.0 /100 | #184 | Fair 95.6% |
| Blacks/African Americans | 34.8 /100 | #185 | Fair 95.6% |
| Brazilians | 34.8 /100 | #186 | Fair 95.6% |
| Sudanese | 33.0 /100 | #187 | Fair 95.6% |