Immigrants from Burma/Myanmar vs Iraqi Median Household Income
COMPARE
Immigrants from Burma/Myanmar
Iraqi
Median Household Income
Median Household Income Comparison
Immigrants from Burma/Myanmar
Iraqis
$78,682
MEDIAN HOUSEHOLD INCOME
1.6/ 100
METRIC RATING
247th/ 347
METRIC RANK
$83,753
MEDIAN HOUSEHOLD INCOME
29.6/ 100
METRIC RATING
191st/ 347
METRIC RANK
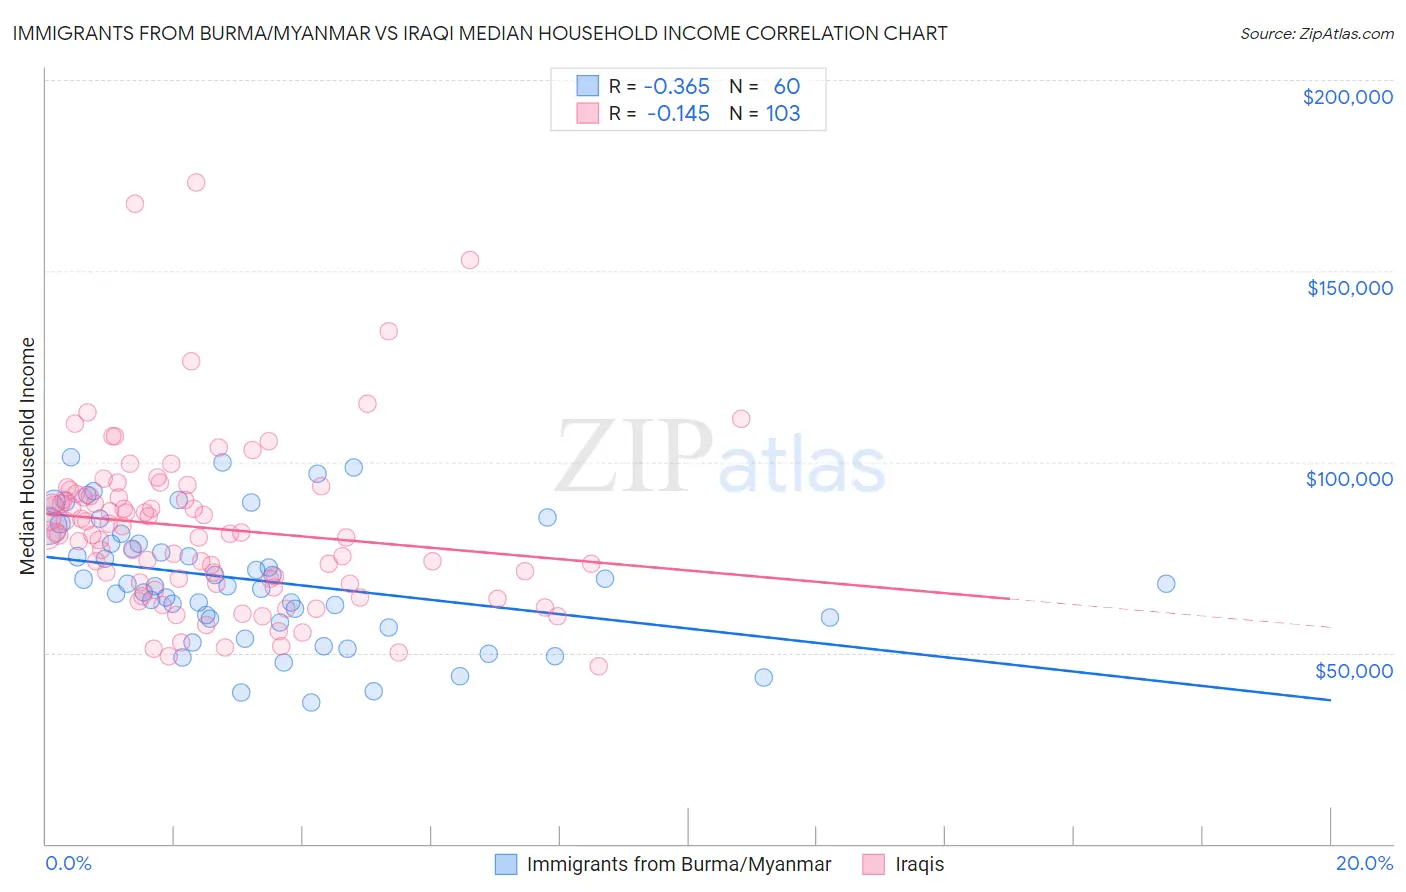
Immigrants from Burma/Myanmar vs Iraqi Median Household Income Correlation Chart
The statistical analysis conducted on geographies consisting of 172,235,466 people shows a mild negative correlation between the proportion of Immigrants from Burma/Myanmar and median household income in the United States with a correlation coefficient (R) of -0.365 and weighted average of $78,682. Similarly, the statistical analysis conducted on geographies consisting of 170,587,047 people shows a poor negative correlation between the proportion of Iraqis and median household income in the United States with a correlation coefficient (R) of -0.145 and weighted average of $83,753, a difference of 6.5%.
Median Household Income Correlation Summary
| Measurement | Immigrants from Burma/Myanmar | Iraqi |
| Minimum | $36,966 | $46,565 |
| Maximum | $101,230 | $173,015 |
| Range | $64,264 | $126,450 |
| Mean | $68,823 | $82,738 |
| Median | $67,779 | $81,250 |
| Interquartile 25% (IQ1) | $58,487 | $68,093 |
| Interquartile 75% (IQ3) | $79,866 | $91,098 |
| Interquartile Range (IQR) | $21,379 | $23,005 |
| Standard Deviation (Sample) | $16,228 | $22,309 |
| Standard Deviation (Population) | $16,092 | $22,201 |
Similar Demographics by Median Household Income
Demographics Similar to Immigrants from Burma/Myanmar by Median Household Income
In terms of median household income, the demographic groups most similar to Immigrants from Burma/Myanmar are Central American ($78,803, a difference of 0.15%), Sudanese ($78,529, a difference of 0.19%), Inupiat ($78,841, a difference of 0.20%), West Indian ($78,455, a difference of 0.29%), and Marshallese ($78,930, a difference of 0.32%).
| Demographics | Rating | Rank | Median Household Income |
| Immigrants | Western Africa | 2.7 /100 | #240 | Tragic $79,490 |
| Immigrants | Nonimmigrants | 2.6 /100 | #241 | Tragic $79,429 |
| Immigrants | Sudan | 2.1 /100 | #242 | Tragic $79,103 |
| Immigrants | Barbados | 1.9 /100 | #243 | Tragic $78,989 |
| Marshallese | 1.9 /100 | #244 | Tragic $78,930 |
| Inupiat | 1.8 /100 | #245 | Tragic $78,841 |
| Central Americans | 1.7 /100 | #246 | Tragic $78,803 |
| Immigrants | Burma/Myanmar | 1.6 /100 | #247 | Tragic $78,682 |
| Sudanese | 1.5 /100 | #248 | Tragic $78,529 |
| West Indians | 1.4 /100 | #249 | Tragic $78,455 |
| Immigrants | Laos | 1.3 /100 | #250 | Tragic $78,327 |
| Mexican American Indians | 1.2 /100 | #251 | Tragic $78,166 |
| Immigrants | West Indies | 1.0 /100 | #252 | Tragic $77,956 |
| Immigrants | St. Vincent and the Grenadines | 0.9 /100 | #253 | Tragic $77,690 |
| Sub-Saharan Africans | 0.8 /100 | #254 | Tragic $77,631 |
Demographics Similar to Iraqis by Median Household Income
In terms of median household income, the demographic groups most similar to Iraqis are Slovak ($83,798, a difference of 0.050%), Welsh ($83,628, a difference of 0.15%), Immigrants from Colombia ($83,902, a difference of 0.18%), Finnish ($83,607, a difference of 0.18%), and Ghanaian ($83,582, a difference of 0.21%).
| Demographics | Rating | Rank | Median Household Income |
| Immigrants | Eastern Africa | 37.4 /100 | #184 | Fair $84,299 |
| Kenyans | 34.2 /100 | #185 | Fair $84,085 |
| Puget Sound Salish | 33.2 /100 | #186 | Fair $84,011 |
| Belgians | 33.2 /100 | #187 | Fair $84,008 |
| Tlingit-Haida | 32.6 /100 | #188 | Fair $83,968 |
| Immigrants | Colombia | 31.7 /100 | #189 | Fair $83,902 |
| Slovaks | 30.2 /100 | #190 | Fair $83,798 |
| Iraqis | 29.6 /100 | #191 | Fair $83,753 |
| Welsh | 28.0 /100 | #192 | Fair $83,628 |
| Finns | 27.7 /100 | #193 | Fair $83,607 |
| Ghanaians | 27.4 /100 | #194 | Fair $83,582 |
| Immigrants | Armenia | 27.0 /100 | #195 | Fair $83,555 |
| French | 26.0 /100 | #196 | Fair $83,468 |
| Aleuts | 25.7 /100 | #197 | Fair $83,446 |
| Japanese | 25.1 /100 | #198 | Fair $83,395 |