Immigrants from Switzerland vs Soviet Union 1 or more Vehicles in Household
COMPARE
Immigrants from Switzerland
Soviet Union
1 or more Vehicles in Household
1 or more Vehicles in Household Comparison
Immigrants from Switzerland
Soviet Union
87.9%
1 OR MORE VEHICLES IN HOUSEHOLD
0.6/ 100
METRIC RATING
261st/ 347
METRIC RANK
82.7%
1 OR MORE VEHICLES IN HOUSEHOLD
0.0/ 100
METRIC RATING
320th/ 347
METRIC RANK
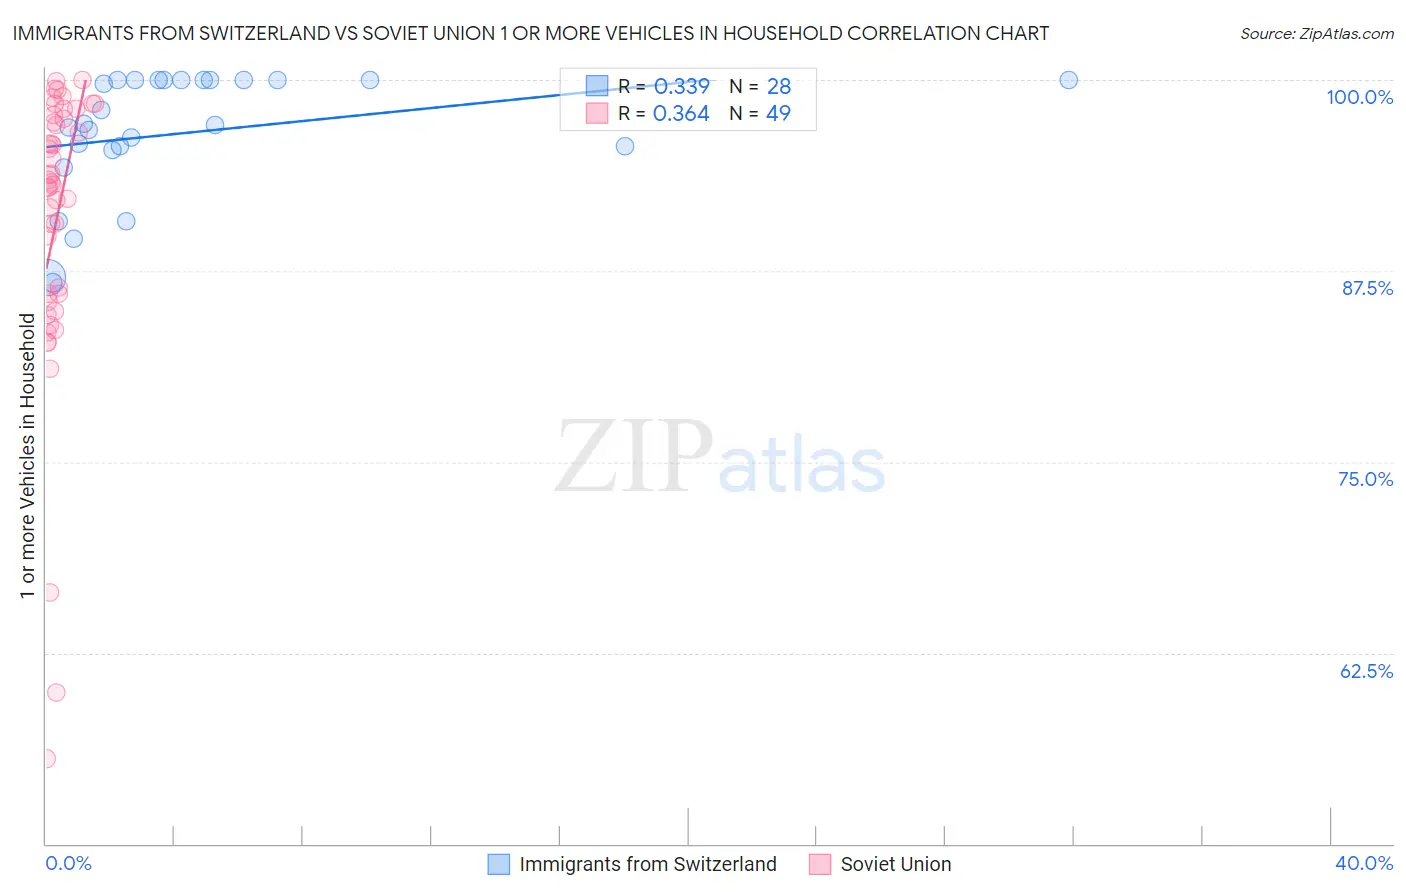
Immigrants from Switzerland vs Soviet Union 1 or more Vehicles in Household Correlation Chart
The statistical analysis conducted on geographies consisting of 148,062,168 people shows a mild positive correlation between the proportion of Immigrants from Switzerland and percentage of households with 1 or more vehicles available in the United States with a correlation coefficient (R) of 0.339 and weighted average of 87.9%. Similarly, the statistical analysis conducted on geographies consisting of 43,492,822 people shows a mild positive correlation between the proportion of Soviet Union and percentage of households with 1 or more vehicles available in the United States with a correlation coefficient (R) of 0.364 and weighted average of 82.7%, a difference of 6.3%.
1 or more Vehicles in Household Correlation Summary
| Measurement | Immigrants from Switzerland | Soviet Union |
| Minimum | 86.7% | 55.6% |
| Maximum | 100.0% | 100.0% |
| Range | 13.3% | 44.4% |
| Mean | 96.6% | 90.7% |
| Median | 97.1% | 93.3% |
| Interquartile 25% (IQ1) | 95.5% | 85.7% |
| Interquartile 75% (IQ3) | 100.0% | 97.6% |
| Interquartile Range (IQR) | 4.5% | 11.8% |
| Standard Deviation (Sample) | 4.1% | 9.6% |
| Standard Deviation (Population) | 4.0% | 9.5% |
Similar Demographics by 1 or more Vehicles in Household
Demographics Similar to Immigrants from Switzerland by 1 or more Vehicles in Household
In terms of 1 or more vehicles in household, the demographic groups most similar to Immigrants from Switzerland are Subsaharan African (87.9%, a difference of 0.030%), Macedonian (87.9%, a difference of 0.040%), Immigrants from Egypt (87.8%, a difference of 0.10%), Immigrants from Liberia (87.8%, a difference of 0.11%), and Nigerian (88.0%, a difference of 0.13%).
| Demographics | Rating | Rank | 1 or more Vehicles in Household |
| Haitians | 0.9 /100 | #254 | Tragic 88.1% |
| Immigrants | Latvia | 0.9 /100 | #255 | Tragic 88.1% |
| Colombians | 0.9 /100 | #256 | Tragic 88.0% |
| Liberians | 0.9 /100 | #257 | Tragic 88.0% |
| South American Indians | 0.9 /100 | #258 | Tragic 88.0% |
| Nigerians | 0.8 /100 | #259 | Tragic 88.0% |
| Macedonians | 0.6 /100 | #260 | Tragic 87.9% |
| Immigrants | Switzerland | 0.6 /100 | #261 | Tragic 87.9% |
| Sub-Saharan Africans | 0.5 /100 | #262 | Tragic 87.9% |
| Immigrants | Egypt | 0.5 /100 | #263 | Tragic 87.8% |
| Immigrants | Liberia | 0.4 /100 | #264 | Tragic 87.8% |
| Africans | 0.4 /100 | #265 | Tragic 87.8% |
| Israelis | 0.3 /100 | #266 | Tragic 87.7% |
| Immigrants | Colombia | 0.3 /100 | #267 | Tragic 87.6% |
| Immigrants | Europe | 0.2 /100 | #268 | Tragic 87.6% |
Demographics Similar to Soviet Union by 1 or more Vehicles in Household
In terms of 1 or more vehicles in household, the demographic groups most similar to Soviet Union are Jamaican (82.1%, a difference of 0.64%), Immigrants from Belarus (83.3%, a difference of 0.81%), Immigrants from Ghana (83.4%, a difference of 0.94%), Ghanaian (83.6%, a difference of 1.1%), and Immigrants from Cabo Verde (81.6%, a difference of 1.3%).
| Demographics | Rating | Rank | 1 or more Vehicles in Household |
| Immigrants | Israel | 0.0 /100 | #313 | Tragic 84.5% |
| Albanians | 0.0 /100 | #314 | Tragic 84.4% |
| Cypriots | 0.0 /100 | #315 | Tragic 84.4% |
| Alaska Natives | 0.0 /100 | #316 | Tragic 83.8% |
| Ghanaians | 0.0 /100 | #317 | Tragic 83.6% |
| Immigrants | Ghana | 0.0 /100 | #318 | Tragic 83.4% |
| Immigrants | Belarus | 0.0 /100 | #319 | Tragic 83.3% |
| Soviet Union | 0.0 /100 | #320 | Tragic 82.7% |
| Jamaicans | 0.0 /100 | #321 | Tragic 82.1% |
| Immigrants | Cabo Verde | 0.0 /100 | #322 | Tragic 81.6% |
| Immigrants | Yemen | 0.0 /100 | #323 | Tragic 80.5% |
| Immigrants | Caribbean | 0.0 /100 | #324 | Tragic 80.4% |
| Senegalese | 0.0 /100 | #325 | Tragic 80.4% |
| Immigrants | West Indies | 0.0 /100 | #326 | Tragic 79.5% |
| Immigrants | Senegal | 0.0 /100 | #327 | Tragic 79.0% |