Kenyan vs German Russian Householder Income Ages 25 - 44 years
COMPARE
Kenyan
German Russian
Householder Income Ages 25 - 44 years
Householder Income Ages 25 - 44 years Comparison
Kenyans
German Russians
$91,684
HOUSEHOLDER INCOME AGES 25 - 44 YEARS
16.8/ 100
METRIC RATING
199th/ 347
METRIC RANK
$85,220
HOUSEHOLDER INCOME AGES 25 - 44 YEARS
0.6/ 100
METRIC RATING
255th/ 347
METRIC RANK
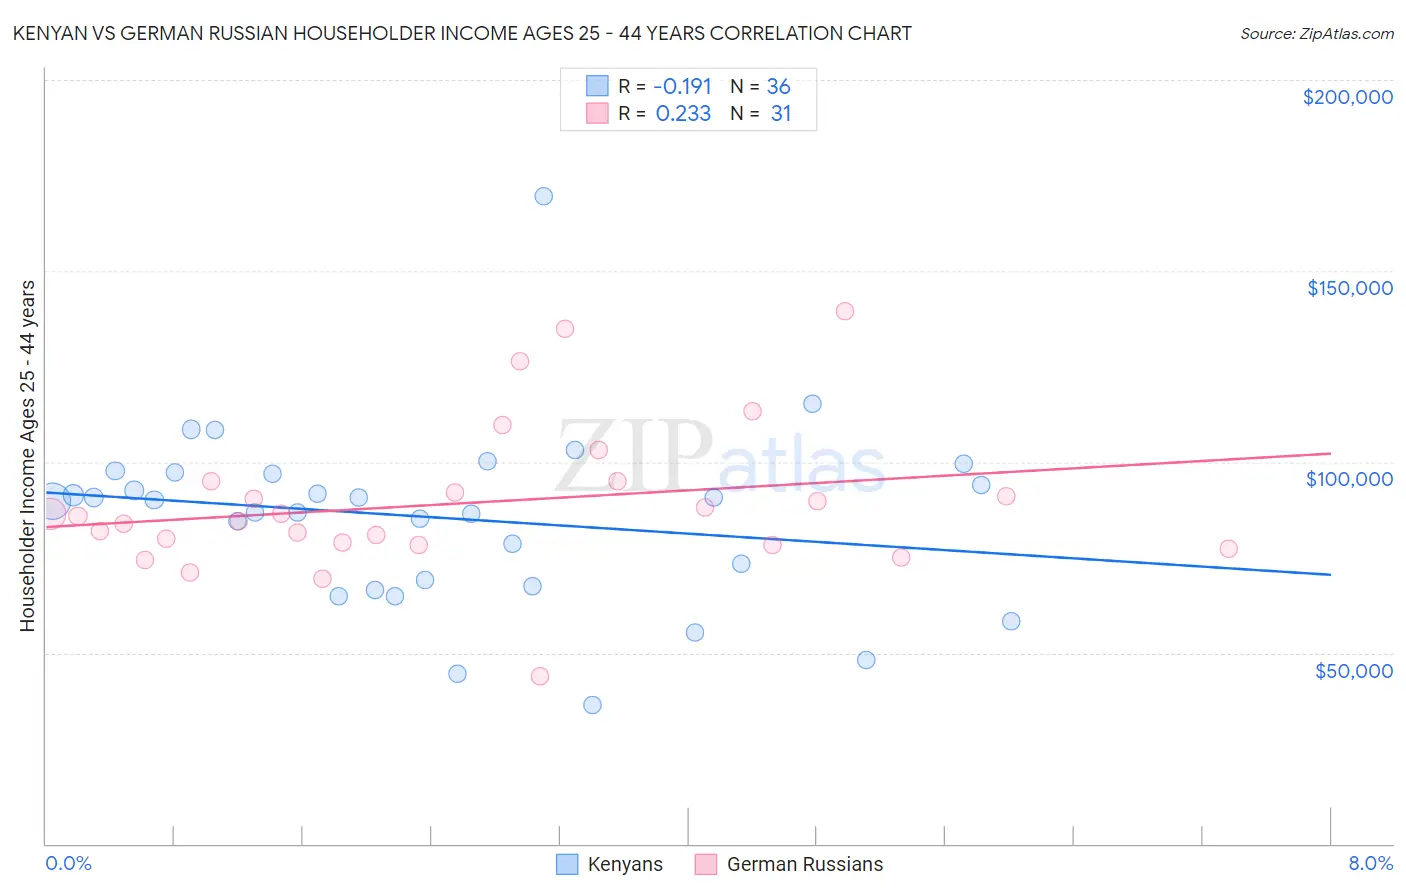
Kenyan vs German Russian Householder Income Ages 25 - 44 years Correlation Chart
The statistical analysis conducted on geographies consisting of 168,058,710 people shows a poor negative correlation between the proportion of Kenyans and household income with householder between the ages 25 and 44 in the United States with a correlation coefficient (R) of -0.191 and weighted average of $91,684. Similarly, the statistical analysis conducted on geographies consisting of 96,370,550 people shows a weak positive correlation between the proportion of German Russians and household income with householder between the ages 25 and 44 in the United States with a correlation coefficient (R) of 0.233 and weighted average of $85,220, a difference of 7.6%.
Householder Income Ages 25 - 44 years Correlation Summary
| Measurement | Kenyan | German Russian |
| Minimum | $36,414 | $43,750 |
| Maximum | $169,412 | $139,479 |
| Range | $132,998 | $95,729 |
| Mean | $85,374 | $89,217 |
| Median | $89,858 | $85,878 |
| Interquartile 25% (IQ1) | $68,236 | $78,393 |
| Interquartile 75% (IQ3) | $97,027 | $94,895 |
| Interquartile Range (IQR) | $28,791 | $16,502 |
| Standard Deviation (Sample) | $23,657 | $19,398 |
| Standard Deviation (Population) | $23,326 | $19,082 |
Similar Demographics by Householder Income Ages 25 - 44 years
Demographics Similar to Kenyans by Householder Income Ages 25 - 44 years
In terms of householder income ages 25 - 44 years, the demographic groups most similar to Kenyans are White/Caucasian ($91,668, a difference of 0.020%), Japanese ($91,624, a difference of 0.070%), Ecuadorian ($91,574, a difference of 0.12%), Immigrants from Cambodia ($91,533, a difference of 0.16%), and Nepalese ($91,498, a difference of 0.20%).
| Demographics | Rating | Rank | Householder Income Ages 25 - 44 years |
| Immigrants | Costa Rica | 28.2 /100 | #192 | Fair $92,876 |
| Samoans | 23.0 /100 | #193 | Fair $92,385 |
| Immigrants | Azores | 22.4 /100 | #194 | Fair $92,322 |
| Celtics | 21.6 /100 | #195 | Fair $92,241 |
| Immigrants | Colombia | 21.3 /100 | #196 | Fair $92,204 |
| Spanish | 21.2 /100 | #197 | Fair $92,200 |
| Vietnamese | 20.2 /100 | #198 | Fair $92,089 |
| Kenyans | 16.8 /100 | #199 | Poor $91,684 |
| Whites/Caucasians | 16.7 /100 | #200 | Poor $91,668 |
| Japanese | 16.4 /100 | #201 | Poor $91,624 |
| Ecuadorians | 16.0 /100 | #202 | Poor $91,574 |
| Immigrants | Cambodia | 15.7 /100 | #203 | Poor $91,533 |
| Nepalese | 15.4 /100 | #204 | Poor $91,498 |
| Immigrants | Eastern Africa | 15.2 /100 | #205 | Poor $91,458 |
| Aleuts | 14.5 /100 | #206 | Poor $91,370 |
Demographics Similar to German Russians by Householder Income Ages 25 - 44 years
In terms of householder income ages 25 - 44 years, the demographic groups most similar to German Russians are Central American ($85,144, a difference of 0.090%), Mexican American Indian ($85,066, a difference of 0.18%), Immigrants from Nicaragua ($84,914, a difference of 0.36%), Immigrants from Laos ($85,553, a difference of 0.39%), and British West Indian ($85,565, a difference of 0.40%).
| Demographics | Rating | Rank | Householder Income Ages 25 - 44 years |
| Immigrants | Sudan | 0.9 /100 | #248 | Tragic $86,109 |
| French American Indians | 0.8 /100 | #249 | Tragic $85,899 |
| Pennsylvania Germans | 0.8 /100 | #250 | Tragic $85,836 |
| Cape Verdeans | 0.8 /100 | #251 | Tragic $85,758 |
| Immigrants | Western Africa | 0.7 /100 | #252 | Tragic $85,676 |
| British West Indians | 0.7 /100 | #253 | Tragic $85,565 |
| Immigrants | Laos | 0.7 /100 | #254 | Tragic $85,553 |
| German Russians | 0.6 /100 | #255 | Tragic $85,220 |
| Central Americans | 0.5 /100 | #256 | Tragic $85,144 |
| Mexican American Indians | 0.5 /100 | #257 | Tragic $85,066 |
| Immigrants | Nicaragua | 0.5 /100 | #258 | Tragic $84,914 |
| Immigrants | Senegal | 0.5 /100 | #259 | Tragic $84,848 |
| Americans | 0.4 /100 | #260 | Tragic $84,791 |
| Inupiat | 0.4 /100 | #261 | Tragic $84,619 |
| Cree | 0.4 /100 | #262 | Tragic $84,574 |