Immigrants from Sudan vs German Russian 12th Grade, No Diploma
COMPARE
Immigrants from Sudan
German Russian
12th Grade, No Diploma
12th Grade, No Diploma Comparison
Immigrants from Sudan
German Russians
90.8%
12TH GRADE, NO DIPLOMA
22.6/ 100
METRIC RATING
197th/ 347
METRIC RANK
91.8%
12TH GRADE, NO DIPLOMA
89.8/ 100
METRIC RATING
129th/ 347
METRIC RANK
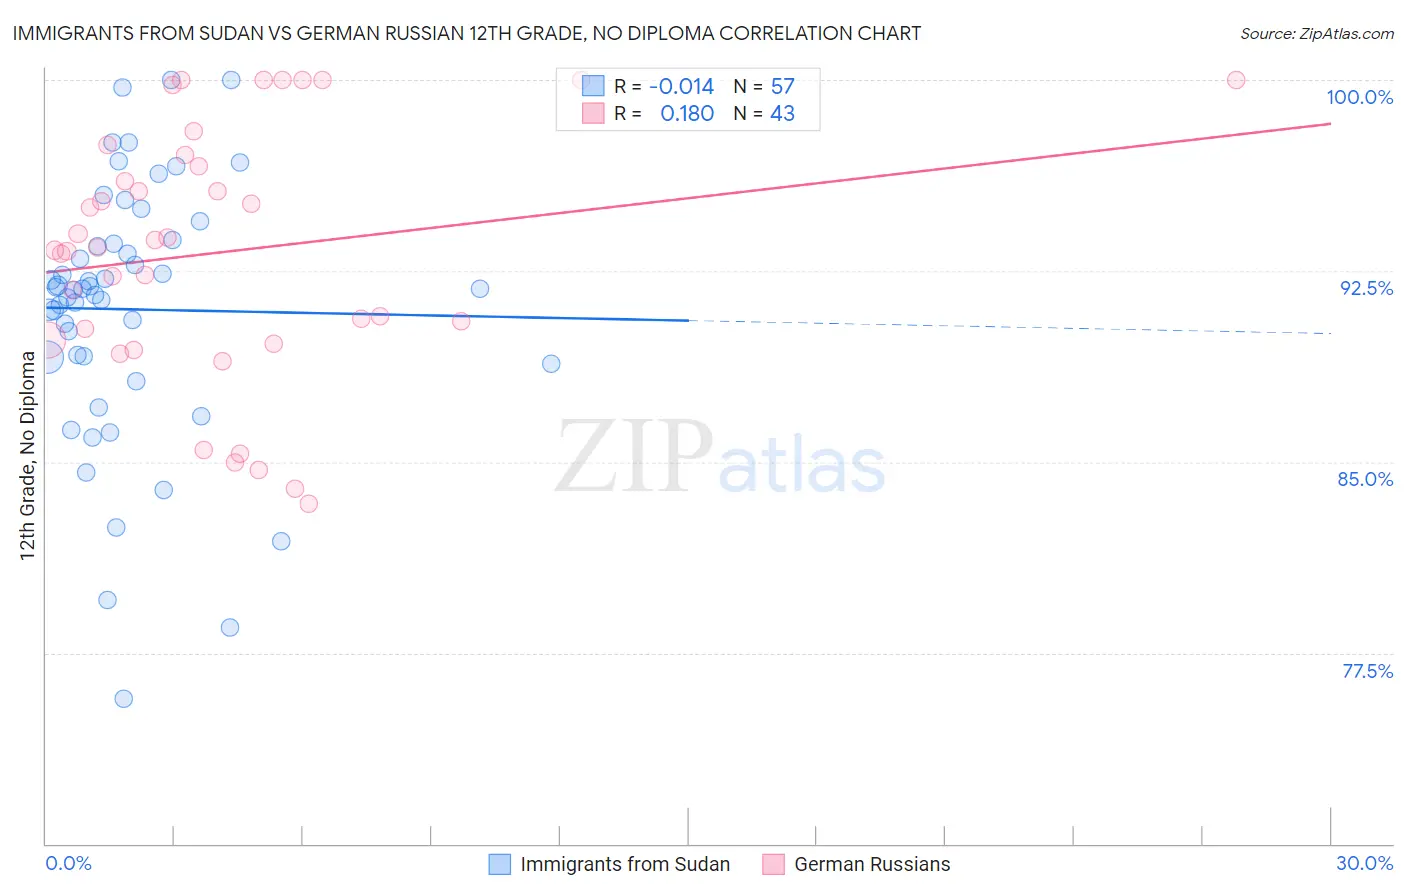
Immigrants from Sudan vs German Russian 12th Grade, No Diploma Correlation Chart
The statistical analysis conducted on geographies consisting of 118,959,807 people shows no correlation between the proportion of Immigrants from Sudan and percentage of population with at least 12th grade (no diploma) education in the United States with a correlation coefficient (R) of -0.014 and weighted average of 90.8%. Similarly, the statistical analysis conducted on geographies consisting of 96,461,984 people shows a poor positive correlation between the proportion of German Russians and percentage of population with at least 12th grade (no diploma) education in the United States with a correlation coefficient (R) of 0.180 and weighted average of 91.8%, a difference of 1.1%.
12th Grade, No Diploma Correlation Summary
| Measurement | Immigrants from Sudan | German Russian |
| Minimum | 75.7% | 83.3% |
| Maximum | 100.0% | 100.0% |
| Range | 24.3% | 16.7% |
| Mean | 91.0% | 93.2% |
| Median | 91.8% | 93.4% |
| Interquartile 25% (IQ1) | 89.0% | 89.8% |
| Interquartile 75% (IQ3) | 93.7% | 97.1% |
| Interquartile Range (IQR) | 4.7% | 7.3% |
| Standard Deviation (Sample) | 5.1% | 4.9% |
| Standard Deviation (Population) | 5.1% | 4.9% |
Similar Demographics by 12th Grade, No Diploma
Demographics Similar to Immigrants from Sudan by 12th Grade, No Diploma
In terms of 12th grade, no diploma, the demographic groups most similar to Immigrants from Sudan are Panamanian (90.8%, a difference of 0.0%), Korean (90.8%, a difference of 0.030%), Samoan (90.8%, a difference of 0.040%), Immigrants from Southern Europe (90.8%, a difference of 0.050%), and Liberian (90.8%, a difference of 0.050%).
| Demographics | Rating | Rank | 12th Grade, No Diploma |
| Afghans | 29.9 /100 | #190 | Fair 90.9% |
| Moroccans | 28.8 /100 | #191 | Fair 90.9% |
| Immigrants | Eastern Africa | 27.7 /100 | #192 | Fair 90.9% |
| Immigrants | Ethiopia | 27.2 /100 | #193 | Fair 90.9% |
| Immigrants | Oceania | 26.0 /100 | #194 | Fair 90.9% |
| Koreans | 24.5 /100 | #195 | Fair 90.8% |
| Panamanians | 22.8 /100 | #196 | Fair 90.8% |
| Immigrants | Sudan | 22.6 /100 | #197 | Fair 90.8% |
| Samoans | 20.4 /100 | #198 | Fair 90.8% |
| Immigrants | Southern Europe | 19.9 /100 | #199 | Poor 90.8% |
| Liberians | 19.8 /100 | #200 | Poor 90.8% |
| Hawaiians | 19.7 /100 | #201 | Poor 90.8% |
| Marshallese | 18.2 /100 | #202 | Poor 90.7% |
| Tongans | 16.1 /100 | #203 | Poor 90.7% |
| French American Indians | 15.5 /100 | #204 | Poor 90.7% |
Demographics Similar to German Russians by 12th Grade, No Diploma
In terms of 12th grade, no diploma, the demographic groups most similar to German Russians are Assyrian/Chaldean/Syriac (91.8%, a difference of 0.0%), Mongolian (91.8%, a difference of 0.010%), Albanian (91.8%, a difference of 0.010%), Immigrants from Eastern Asia (91.8%, a difference of 0.020%), and Immigrants from Jordan (91.8%, a difference of 0.040%).
| Demographics | Rating | Rank | 12th Grade, No Diploma |
| Ottawa | 93.1 /100 | #122 | Exceptional 91.9% |
| Egyptians | 92.5 /100 | #123 | Exceptional 91.9% |
| Immigrants | Ukraine | 91.6 /100 | #124 | Exceptional 91.8% |
| Whites/Caucasians | 91.6 /100 | #125 | Exceptional 91.8% |
| Basques | 91.3 /100 | #126 | Exceptional 91.8% |
| Immigrants | Jordan | 91.0 /100 | #127 | Exceptional 91.8% |
| Mongolians | 89.9 /100 | #128 | Excellent 91.8% |
| German Russians | 89.8 /100 | #129 | Excellent 91.8% |
| Assyrians/Chaldeans/Syriacs | 89.6 /100 | #130 | Excellent 91.8% |
| Albanians | 89.3 /100 | #131 | Excellent 91.8% |
| Immigrants | Eastern Asia | 89.3 /100 | #132 | Excellent 91.8% |
| Immigrants | Italy | 88.3 /100 | #133 | Excellent 91.7% |
| Venezuelans | 88.2 /100 | #134 | Excellent 91.7% |
| Immigrants | Bosnia and Herzegovina | 87.3 /100 | #135 | Excellent 91.7% |
| Chileans | 85.8 /100 | #136 | Excellent 91.7% |