Immigrants from Sri Lanka vs Tlingit-Haida Unemployment Among Women with Children Ages 6 to 17 years
COMPARE
Immigrants from Sri Lanka
Tlingit-Haida
Unemployment Among Women with Children Ages 6 to 17 years
Unemployment Among Women with Children Ages 6 to 17 years Comparison
Immigrants from Sri Lanka
Tlingit-Haida
8.4%
UNEMPLOYMENT AMONG WOMEN WITH CHILDREN AGES 6 TO 17 YEARS
99.7/ 100
METRIC RATING
75th/ 347
METRIC RANK
7.1%
UNEMPLOYMENT AMONG WOMEN WITH CHILDREN AGES 6 TO 17 YEARS
100.0/ 100
METRIC RATING
6th/ 347
METRIC RANK
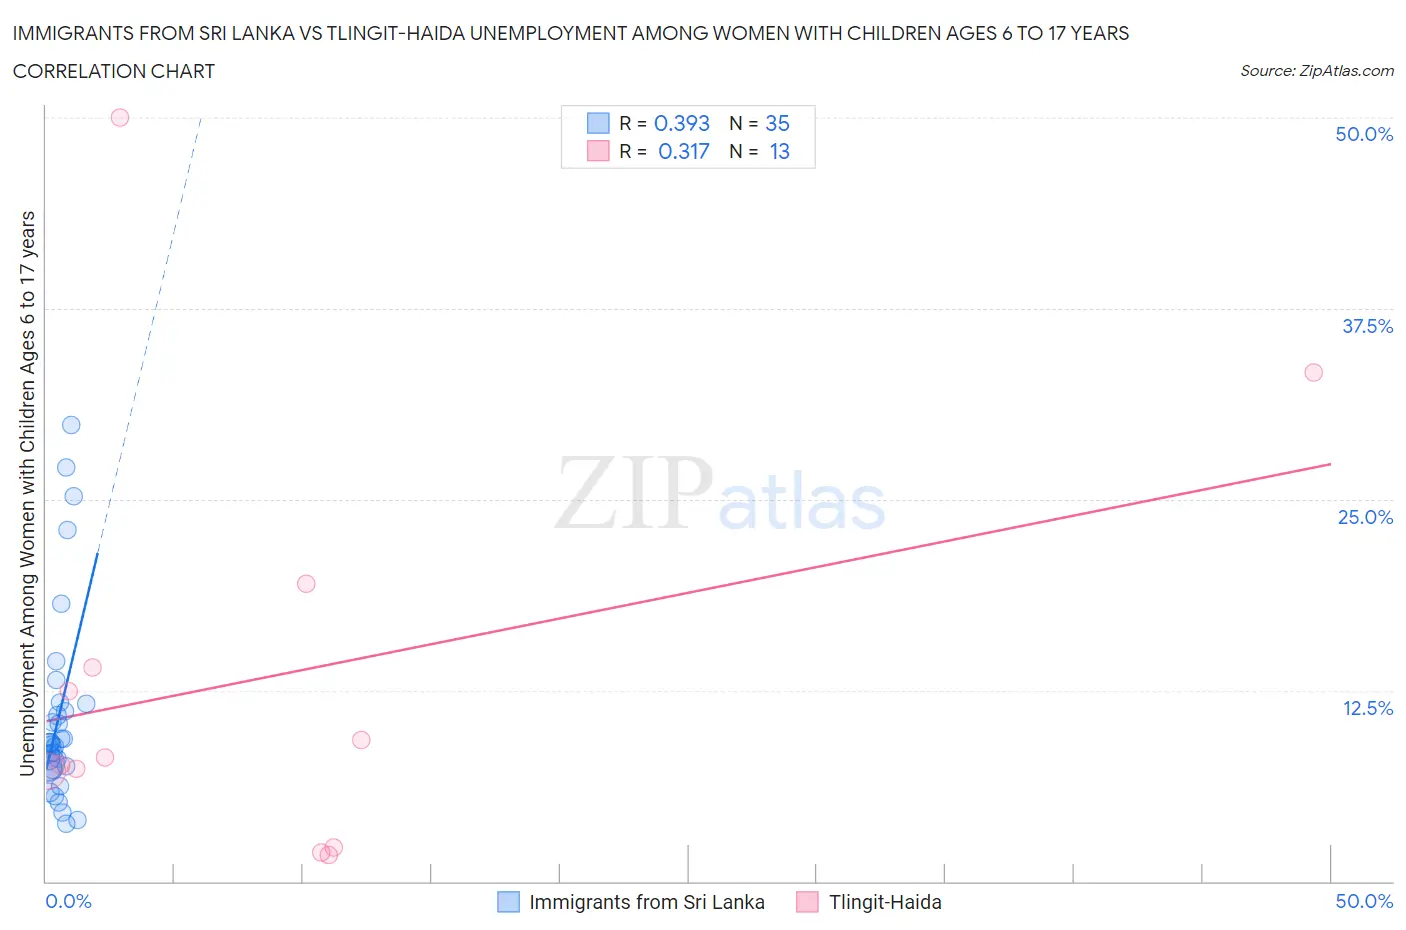
Immigrants from Sri Lanka vs Tlingit-Haida Unemployment Among Women with Children Ages 6 to 17 years Correlation Chart
The statistical analysis conducted on geographies consisting of 125,381,716 people shows a mild positive correlation between the proportion of Immigrants from Sri Lanka and unemployment rate among women with children between the ages 6 and 17 in the United States with a correlation coefficient (R) of 0.393 and weighted average of 8.4%. Similarly, the statistical analysis conducted on geographies consisting of 52,453,668 people shows a mild positive correlation between the proportion of Tlingit-Haida and unemployment rate among women with children between the ages 6 and 17 in the United States with a correlation coefficient (R) of 0.317 and weighted average of 7.1%, a difference of 18.5%.
Unemployment Among Women with Children Ages 6 to 17 years Correlation Summary
| Measurement | Immigrants from Sri Lanka | Tlingit-Haida |
| Minimum | 3.8% | 1.7% |
| Maximum | 29.9% | 50.0% |
| Range | 26.1% | 48.3% |
| Mean | 10.8% | 13.4% |
| Median | 9.0% | 8.1% |
| Interquartile 25% (IQ1) | 7.5% | 4.7% |
| Interquartile 75% (IQ3) | 11.6% | 16.8% |
| Interquartile Range (IQR) | 4.1% | 12.0% |
| Standard Deviation (Sample) | 6.4% | 13.9% |
| Standard Deviation (Population) | 6.3% | 13.4% |
Similar Demographics by Unemployment Among Women with Children Ages 6 to 17 years
Demographics Similar to Immigrants from Sri Lanka by Unemployment Among Women with Children Ages 6 to 17 years
In terms of unemployment among women with children ages 6 to 17 years, the demographic groups most similar to Immigrants from Sri Lanka are Immigrants from Moldova (8.4%, a difference of 0.020%), Samoan (8.4%, a difference of 0.080%), Iraqi (8.4%, a difference of 0.080%), Pakistani (8.4%, a difference of 0.21%), and Mongolian (8.4%, a difference of 0.22%).
| Demographics | Rating | Rank | Unemployment Among Women with Children Ages 6 to 17 years |
| Marshallese | 99.9 /100 | #68 | Exceptional 8.3% |
| Immigrants | Thailand | 99.9 /100 | #69 | Exceptional 8.3% |
| Norwegians | 99.9 /100 | #70 | Exceptional 8.3% |
| Immigrants | Australia | 99.8 /100 | #71 | Exceptional 8.3% |
| Immigrants | Nepal | 99.8 /100 | #72 | Exceptional 8.3% |
| Spanish Americans | 99.8 /100 | #73 | Exceptional 8.4% |
| Samoans | 99.7 /100 | #74 | Exceptional 8.4% |
| Immigrants | Sri Lanka | 99.7 /100 | #75 | Exceptional 8.4% |
| Immigrants | Moldova | 99.7 /100 | #76 | Exceptional 8.4% |
| Iraqis | 99.7 /100 | #77 | Exceptional 8.4% |
| Pakistanis | 99.6 /100 | #78 | Exceptional 8.4% |
| Mongolians | 99.6 /100 | #79 | Exceptional 8.4% |
| Immigrants | Belarus | 99.6 /100 | #80 | Exceptional 8.4% |
| Immigrants | Bolivia | 99.6 /100 | #81 | Exceptional 8.4% |
| Cypriots | 99.6 /100 | #82 | Exceptional 8.4% |
Demographics Similar to Tlingit-Haida by Unemployment Among Women with Children Ages 6 to 17 years
In terms of unemployment among women with children ages 6 to 17 years, the demographic groups most similar to Tlingit-Haida are Soviet Union (7.1%, a difference of 0.060%), Okinawan (7.0%, a difference of 0.47%), Ute (7.0%, a difference of 1.1%), Immigrants from Hong Kong (7.2%, a difference of 1.5%), and Assyrian/Chaldean/Syriac (7.2%, a difference of 1.8%).
| Demographics | Rating | Rank | Unemployment Among Women with Children Ages 6 to 17 years |
| Taiwanese | 100.0 /100 | #1 | Exceptional 6.5% |
| Fijians | 100.0 /100 | #2 | Exceptional 6.6% |
| Tongans | 100.0 /100 | #3 | Exceptional 6.7% |
| Ute | 100.0 /100 | #4 | Exceptional 7.0% |
| Okinawans | 100.0 /100 | #5 | Exceptional 7.0% |
| Tlingit-Haida | 100.0 /100 | #6 | Exceptional 7.1% |
| Soviet Union | 100.0 /100 | #7 | Exceptional 7.1% |
| Immigrants | Hong Kong | 100.0 /100 | #8 | Exceptional 7.2% |
| Assyrians/Chaldeans/Syriacs | 100.0 /100 | #9 | Exceptional 7.2% |
| Immigrants | Fiji | 100.0 /100 | #10 | Exceptional 7.3% |
| Immigrants | Taiwan | 100.0 /100 | #11 | Exceptional 7.3% |
| Bangladeshis | 100.0 /100 | #12 | Exceptional 7.4% |
| Indonesians | 100.0 /100 | #13 | Exceptional 7.4% |
| Sudanese | 100.0 /100 | #14 | Exceptional 7.4% |
| Puget Sound Salish | 100.0 /100 | #15 | Exceptional 7.5% |