Immigrants from Belgium vs Immigrants from Pakistan Householder Income Ages 25 - 44 years
COMPARE
Immigrants from Belgium
Immigrants from Pakistan
Householder Income Ages 25 - 44 years
Householder Income Ages 25 - 44 years Comparison
Immigrants from Belgium
Immigrants from Pakistan
$112,575
HOUSEHOLDER INCOME AGES 25 - 44 YEARS
100.0/ 100
METRIC RATING
22nd/ 347
METRIC RANK
$106,129
HOUSEHOLDER INCOME AGES 25 - 44 YEARS
99.8/ 100
METRIC RATING
56th/ 347
METRIC RANK
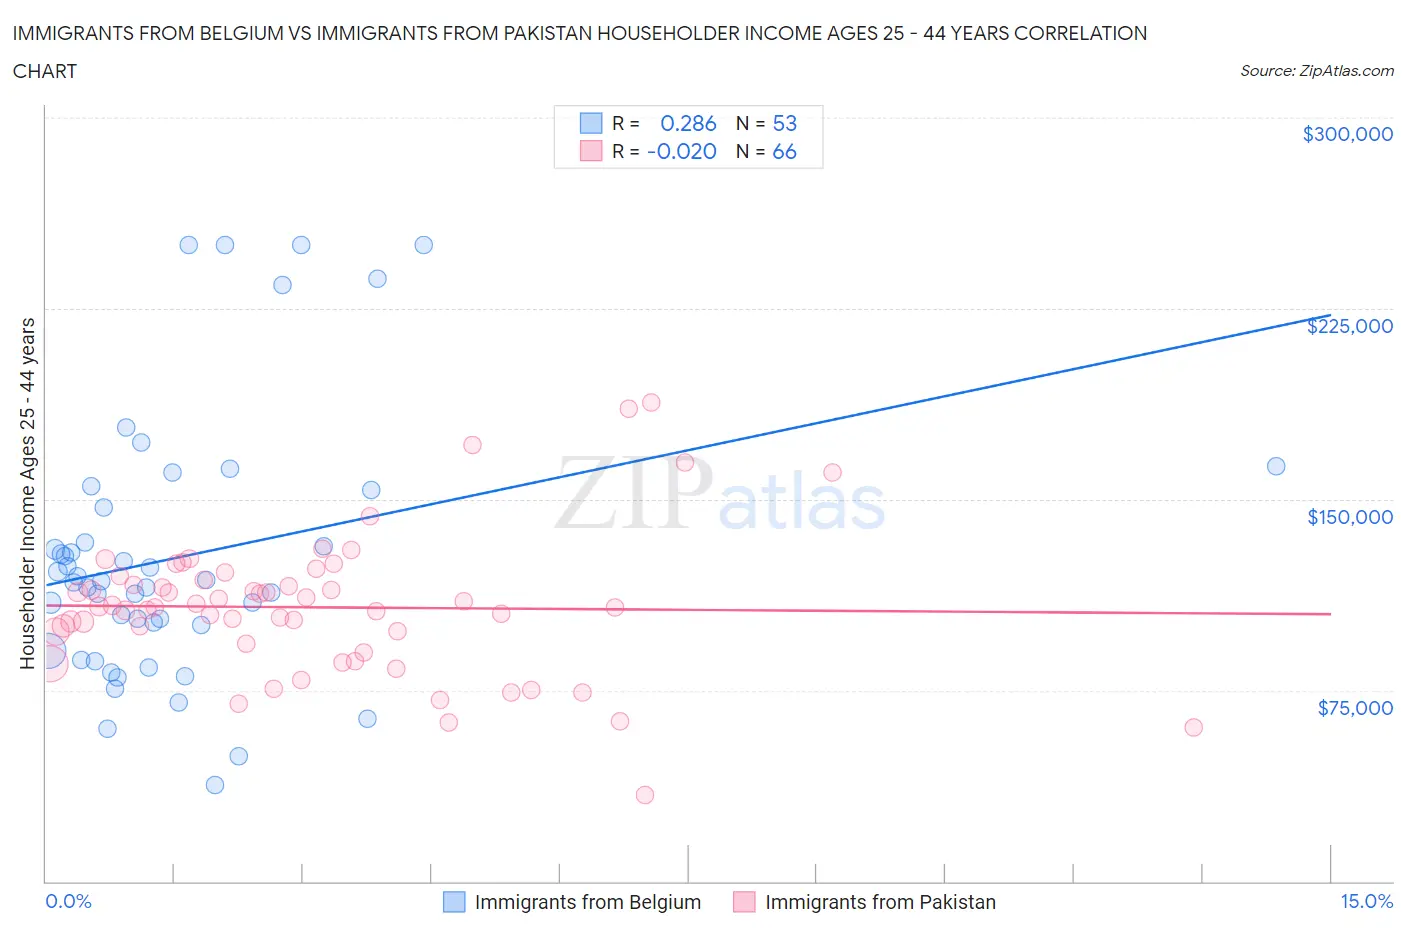
Immigrants from Belgium vs Immigrants from Pakistan Householder Income Ages 25 - 44 years Correlation Chart
The statistical analysis conducted on geographies consisting of 146,567,695 people shows a weak positive correlation between the proportion of Immigrants from Belgium and household income with householder between the ages 25 and 44 in the United States with a correlation coefficient (R) of 0.286 and weighted average of $112,575. Similarly, the statistical analysis conducted on geographies consisting of 283,570,722 people shows no correlation between the proportion of Immigrants from Pakistan and household income with householder between the ages 25 and 44 in the United States with a correlation coefficient (R) of -0.020 and weighted average of $106,129, a difference of 6.1%.
Householder Income Ages 25 - 44 years Correlation Summary
| Measurement | Immigrants from Belgium | Immigrants from Pakistan |
| Minimum | $37,722 | $34,000 |
| Maximum | $250,001 | $187,880 |
| Range | $212,279 | $153,880 |
| Mean | $127,529 | $107,614 |
| Median | $118,034 | $107,714 |
| Interquartile 25% (IQ1) | $95,583 | $93,459 |
| Interquartile 75% (IQ3) | $150,293 | $118,512 |
| Interquartile Range (IQR) | $54,710 | $25,052 |
| Standard Deviation (Sample) | $51,958 | $27,793 |
| Standard Deviation (Population) | $51,466 | $27,582 |
Similar Demographics by Householder Income Ages 25 - 44 years
Demographics Similar to Immigrants from Belgium by Householder Income Ages 25 - 44 years
In terms of householder income ages 25 - 44 years, the demographic groups most similar to Immigrants from Belgium are Asian ($112,666, a difference of 0.080%), Immigrants from Japan ($112,228, a difference of 0.31%), Immigrants from Sweden ($112,010, a difference of 0.50%), Immigrants from Korea ($113,401, a difference of 0.73%), and Immigrants from Northern Europe ($111,676, a difference of 0.80%).
| Demographics | Rating | Rank | Householder Income Ages 25 - 44 years |
| Immigrants | South Central Asia | 100.0 /100 | #15 | Exceptional $116,626 |
| Cypriots | 100.0 /100 | #16 | Exceptional $116,364 |
| Immigrants | Australia | 100.0 /100 | #17 | Exceptional $115,947 |
| Eastern Europeans | 100.0 /100 | #18 | Exceptional $114,523 |
| Burmese | 100.0 /100 | #19 | Exceptional $113,701 |
| Immigrants | Korea | 100.0 /100 | #20 | Exceptional $113,401 |
| Asians | 100.0 /100 | #21 | Exceptional $112,666 |
| Immigrants | Belgium | 100.0 /100 | #22 | Exceptional $112,575 |
| Immigrants | Japan | 100.0 /100 | #23 | Exceptional $112,228 |
| Immigrants | Sweden | 100.0 /100 | #24 | Exceptional $112,010 |
| Immigrants | Northern Europe | 100.0 /100 | #25 | Exceptional $111,676 |
| Immigrants | Asia | 100.0 /100 | #26 | Exceptional $110,787 |
| Russians | 100.0 /100 | #27 | Exceptional $110,398 |
| Immigrants | Denmark | 100.0 /100 | #28 | Exceptional $110,363 |
| Turks | 100.0 /100 | #29 | Exceptional $110,318 |
Demographics Similar to Immigrants from Pakistan by Householder Income Ages 25 - 44 years
In terms of householder income ages 25 - 44 years, the demographic groups most similar to Immigrants from Pakistan are Immigrants from Austria ($106,103, a difference of 0.030%), Greek ($106,457, a difference of 0.31%), Immigrants from South Africa ($105,748, a difference of 0.36%), Paraguayan ($106,615, a difference of 0.46%), and Immigrants from Norway ($106,629, a difference of 0.47%).
| Demographics | Rating | Rank | Householder Income Ages 25 - 44 years |
| Immigrants | Turkey | 99.9 /100 | #49 | Exceptional $107,258 |
| Cambodians | 99.9 /100 | #50 | Exceptional $107,148 |
| Immigrants | Czechoslovakia | 99.9 /100 | #51 | Exceptional $106,888 |
| Immigrants | Europe | 99.9 /100 | #52 | Exceptional $106,817 |
| Immigrants | Norway | 99.9 /100 | #53 | Exceptional $106,629 |
| Paraguayans | 99.9 /100 | #54 | Exceptional $106,615 |
| Greeks | 99.9 /100 | #55 | Exceptional $106,457 |
| Immigrants | Pakistan | 99.8 /100 | #56 | Exceptional $106,129 |
| Immigrants | Austria | 99.8 /100 | #57 | Exceptional $106,103 |
| Immigrants | South Africa | 99.8 /100 | #58 | Exceptional $105,748 |
| Immigrants | Latvia | 99.8 /100 | #59 | Exceptional $105,522 |
| Egyptians | 99.7 /100 | #60 | Exceptional $105,282 |
| Lithuanians | 99.7 /100 | #61 | Exceptional $105,223 |
| Immigrants | Italy | 99.7 /100 | #62 | Exceptional $105,201 |
| Immigrants | Scotland | 99.7 /100 | #63 | Exceptional $105,089 |