Immigrants from Albania vs Immigrants from Jordan Householder Income Ages 25 - 44 years
COMPARE
Immigrants from Albania
Immigrants from Jordan
Householder Income Ages 25 - 44 years
Householder Income Ages 25 - 44 years Comparison
Immigrants from Albania
Immigrants from Jordan
$97,929
HOUSEHOLDER INCOME AGES 25 - 44 YEARS
86.6/ 100
METRIC RATING
131st/ 347
METRIC RANK
$97,185
HOUSEHOLDER INCOME AGES 25 - 44 YEARS
81.0/ 100
METRIC RATING
143rd/ 347
METRIC RANK
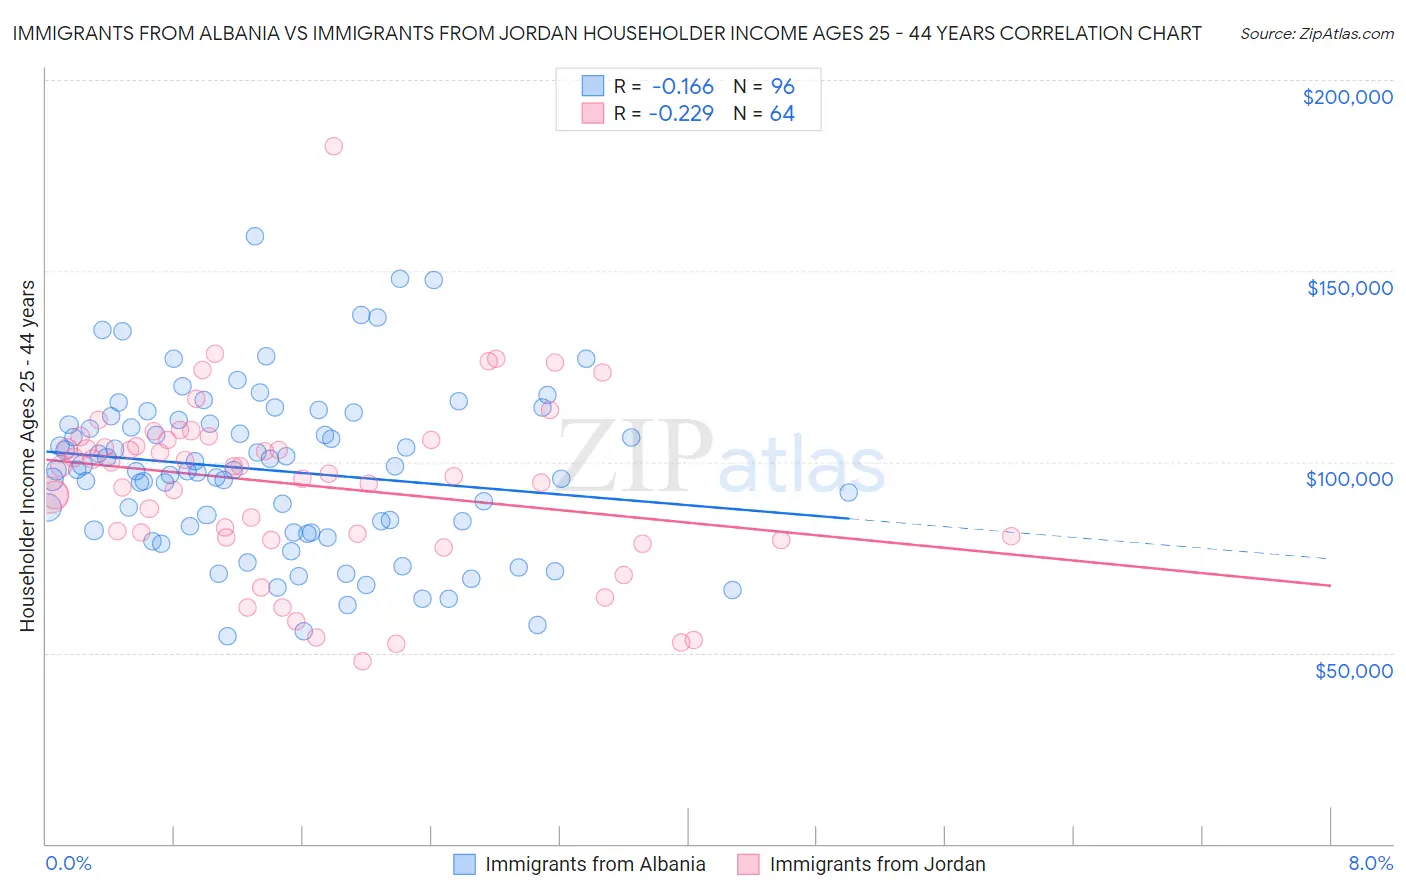
Immigrants from Albania vs Immigrants from Jordan Householder Income Ages 25 - 44 years Correlation Chart
The statistical analysis conducted on geographies consisting of 119,323,359 people shows a poor negative correlation between the proportion of Immigrants from Albania and household income with householder between the ages 25 and 44 in the United States with a correlation coefficient (R) of -0.166 and weighted average of $97,929. Similarly, the statistical analysis conducted on geographies consisting of 181,164,204 people shows a weak negative correlation between the proportion of Immigrants from Jordan and household income with householder between the ages 25 and 44 in the United States with a correlation coefficient (R) of -0.229 and weighted average of $97,185, a difference of 0.77%.
Householder Income Ages 25 - 44 years Correlation Summary
| Measurement | Immigrants from Albania | Immigrants from Jordan |
| Minimum | $54,306 | $47,644 |
| Maximum | $159,200 | $182,512 |
| Range | $104,894 | $134,868 |
| Mean | $97,705 | $94,069 |
| Median | $97,845 | $97,769 |
| Interquartile 25% (IQ1) | $81,795 | $80,422 |
| Interquartile 75% (IQ3) | $110,452 | $105,721 |
| Interquartile Range (IQR) | $28,657 | $25,299 |
| Standard Deviation (Sample) | $21,537 | $23,095 |
| Standard Deviation (Population) | $21,424 | $22,914 |
Demographics Similar to Immigrants from Albania and Immigrants from Jordan by Householder Income Ages 25 - 44 years
In terms of householder income ages 25 - 44 years, the demographic groups most similar to Immigrants from Albania are Immigrants from Zimbabwe ($97,880, a difference of 0.050%), Tsimshian ($97,809, a difference of 0.12%), Immigrants from Kuwait ($98,122, a difference of 0.20%), Canadian ($97,625, a difference of 0.31%), and Immigrants from Oceania ($97,623, a difference of 0.31%). Similarly, the demographic groups most similar to Immigrants from Jordan are Immigrants from Chile ($97,159, a difference of 0.030%), Danish ($97,221, a difference of 0.040%), Luxembourger ($97,237, a difference of 0.050%), Immigrants from Morocco ($97,305, a difference of 0.12%), and Immigrants from Peru ($97,329, a difference of 0.15%).
| Demographics | Rating | Rank | Householder Income Ages 25 - 44 years |
| Serbians | 88.9 /100 | #127 | Excellent $98,320 |
| Europeans | 88.9 /100 | #128 | Excellent $98,310 |
| Brazilians | 88.6 /100 | #129 | Excellent $98,267 |
| Immigrants | Kuwait | 87.8 /100 | #130 | Excellent $98,122 |
| Immigrants | Albania | 86.6 /100 | #131 | Excellent $97,929 |
| Immigrants | Zimbabwe | 86.3 /100 | #132 | Excellent $97,880 |
| Tsimshian | 85.8 /100 | #133 | Excellent $97,809 |
| Canadians | 84.5 /100 | #134 | Excellent $97,625 |
| Immigrants | Oceania | 84.5 /100 | #135 | Excellent $97,623 |
| Hungarians | 83.9 /100 | #136 | Excellent $97,544 |
| Lebanese | 82.3 /100 | #137 | Excellent $97,339 |
| Arabs | 82.3 /100 | #138 | Excellent $97,336 |
| Immigrants | Peru | 82.2 /100 | #139 | Excellent $97,329 |
| Immigrants | Morocco | 82.0 /100 | #140 | Excellent $97,305 |
| Luxembourgers | 81.5 /100 | #141 | Excellent $97,237 |
| Danes | 81.3 /100 | #142 | Excellent $97,221 |
| Immigrants | Jordan | 81.0 /100 | #143 | Excellent $97,185 |
| Immigrants | Chile | 80.8 /100 | #144 | Excellent $97,159 |
| Norwegians | 78.2 /100 | #145 | Good $96,866 |
| Ethiopians | 77.8 /100 | #146 | Good $96,824 |
| Immigrants | Syria | 77.4 /100 | #147 | Good $96,789 |