Immigrants from Senegal vs Tongan Median Household Income
COMPARE
Immigrants from Senegal
Tongan
Median Household Income
Median Household Income Comparison
Immigrants from Senegal
Tongans
$76,915
MEDIAN HOUSEHOLD INCOME
0.5/ 100
METRIC RATING
257th/ 347
METRIC RANK
$93,076
MEDIAN HOUSEHOLD INCOME
99.4/ 100
METRIC RATING
80th/ 347
METRIC RANK
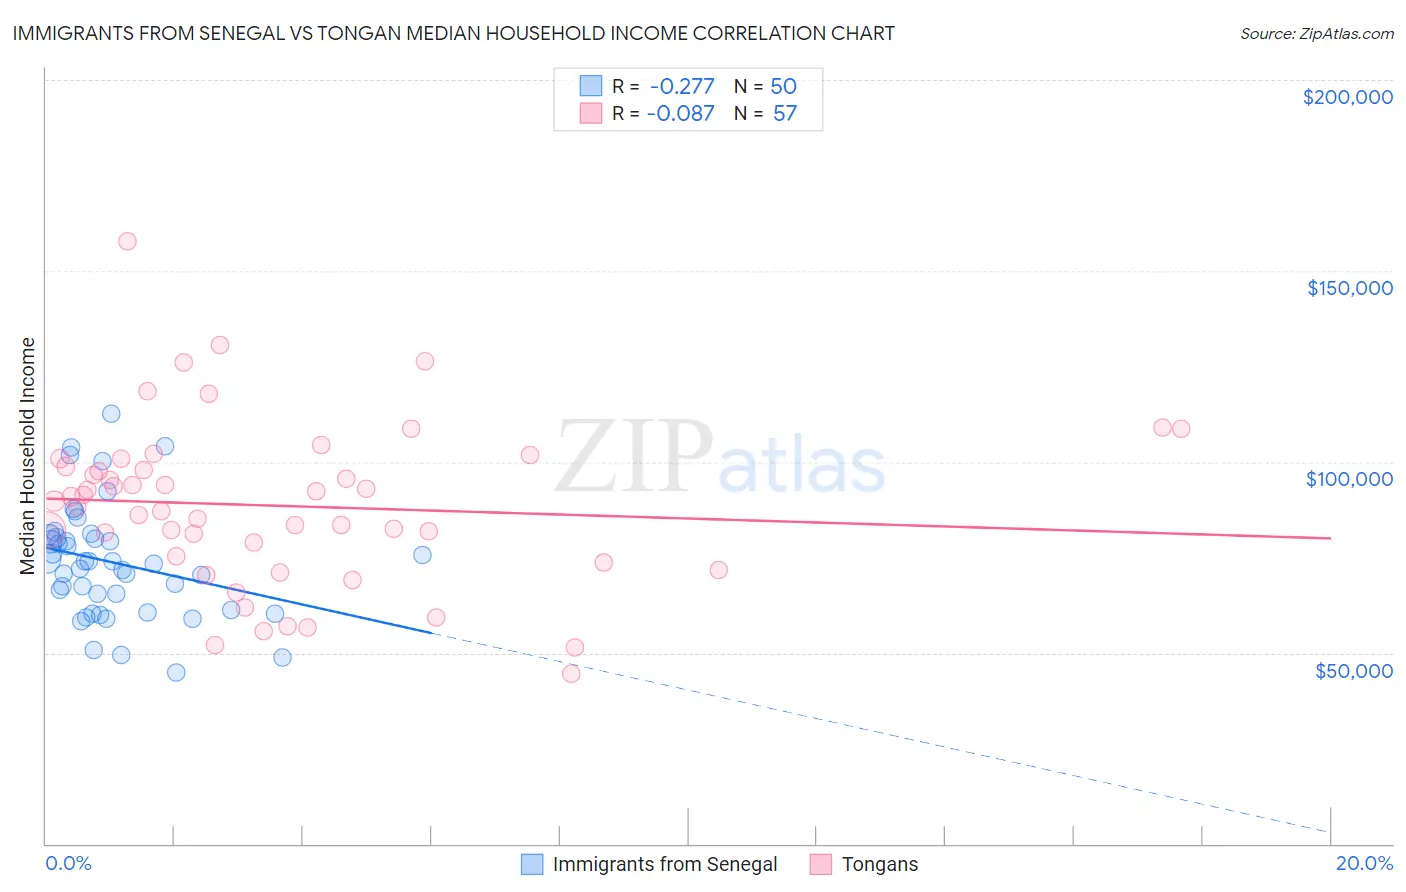
Immigrants from Senegal vs Tongan Median Household Income Correlation Chart
The statistical analysis conducted on geographies consisting of 90,107,777 people shows a weak negative correlation between the proportion of Immigrants from Senegal and median household income in the United States with a correlation coefficient (R) of -0.277 and weighted average of $76,915. Similarly, the statistical analysis conducted on geographies consisting of 102,857,692 people shows a slight negative correlation between the proportion of Tongans and median household income in the United States with a correlation coefficient (R) of -0.087 and weighted average of $93,076, a difference of 21.0%.
Median Household Income Correlation Summary
| Measurement | Immigrants from Senegal | Tongan |
| Minimum | $44,770 | $44,375 |
| Maximum | $112,479 | $157,875 |
| Range | $67,709 | $113,500 |
| Mean | $73,616 | $88,526 |
| Median | $73,578 | $89,840 |
| Interquartile 25% (IQ1) | $61,261 | $74,550 |
| Interquartile 75% (IQ3) | $80,057 | $99,865 |
| Interquartile Range (IQR) | $18,796 | $25,315 |
| Standard Deviation (Sample) | $14,821 | $21,499 |
| Standard Deviation (Population) | $14,672 | $21,310 |
Similar Demographics by Median Household Income
Demographics Similar to Immigrants from Senegal by Median Household Income
In terms of median household income, the demographic groups most similar to Immigrants from Senegal are Belizean ($77,028, a difference of 0.15%), Immigrants from Nicaragua ($76,784, a difference of 0.17%), Spanish American Indian ($76,670, a difference of 0.32%), Jamaican ($76,583, a difference of 0.43%), and Immigrants from Grenada ($76,517, a difference of 0.52%).
| Demographics | Rating | Rank | Median Household Income |
| Immigrants | Laos | 1.3 /100 | #250 | Tragic $78,327 |
| Mexican American Indians | 1.2 /100 | #251 | Tragic $78,166 |
| Immigrants | West Indies | 1.0 /100 | #252 | Tragic $77,956 |
| Immigrants | St. Vincent and the Grenadines | 0.9 /100 | #253 | Tragic $77,690 |
| Sub-Saharan Africans | 0.8 /100 | #254 | Tragic $77,631 |
| Immigrants | Middle Africa | 0.8 /100 | #255 | Tragic $77,559 |
| Belizeans | 0.6 /100 | #256 | Tragic $77,028 |
| Immigrants | Senegal | 0.5 /100 | #257 | Tragic $76,915 |
| Immigrants | Nicaragua | 0.5 /100 | #258 | Tragic $76,784 |
| Spanish American Indians | 0.4 /100 | #259 | Tragic $76,670 |
| Jamaicans | 0.4 /100 | #260 | Tragic $76,583 |
| Immigrants | Grenada | 0.4 /100 | #261 | Tragic $76,517 |
| French American Indians | 0.4 /100 | #262 | Tragic $76,387 |
| Alaskan Athabascans | 0.4 /100 | #263 | Tragic $76,383 |
| Guatemalans | 0.3 /100 | #264 | Tragic $75,961 |
Demographics Similar to Tongans by Median Household Income
In terms of median household income, the demographic groups most similar to Tongans are Sri Lankan ($93,093, a difference of 0.020%), Immigrants from Eastern Europe ($93,051, a difference of 0.030%), Immigrants from Bulgaria ($93,148, a difference of 0.080%), Immigrants from Afghanistan ($93,375, a difference of 0.32%), and South African ($93,379, a difference of 0.33%).
| Demographics | Rating | Rank | Median Household Income |
| Immigrants | Egypt | 99.6 /100 | #73 | Exceptional $93,700 |
| Immigrants | Latvia | 99.6 /100 | #74 | Exceptional $93,602 |
| Immigrants | Italy | 99.5 /100 | #75 | Exceptional $93,465 |
| South Africans | 99.5 /100 | #76 | Exceptional $93,379 |
| Immigrants | Afghanistan | 99.5 /100 | #77 | Exceptional $93,375 |
| Immigrants | Bulgaria | 99.4 /100 | #78 | Exceptional $93,148 |
| Sri Lankans | 99.4 /100 | #79 | Exceptional $93,093 |
| Tongans | 99.4 /100 | #80 | Exceptional $93,076 |
| Immigrants | Eastern Europe | 99.4 /100 | #81 | Exceptional $93,051 |
| Immigrants | Spain | 99.3 /100 | #82 | Exceptional $92,732 |
| Italians | 99.1 /100 | #83 | Exceptional $92,475 |
| Immigrants | Argentina | 99.1 /100 | #84 | Exceptional $92,417 |
| Immigrants | Croatia | 99.0 /100 | #85 | Exceptional $92,225 |
| Immigrants | England | 98.9 /100 | #86 | Exceptional $92,098 |
| Immigrants | Hungary | 98.9 /100 | #87 | Exceptional $92,094 |