Immigrants from Southern Europe vs Bermudan Median Household Income
COMPARE
Immigrants from Southern Europe
Bermudan
Median Household Income
Median Household Income Comparison
Immigrants from Southern Europe
Bermudans
$91,605
MEDIAN HOUSEHOLD INCOME
98.5/ 100
METRIC RATING
98th/ 347
METRIC RANK
$80,406
MEDIAN HOUSEHOLD INCOME
4.7/ 100
METRIC RATING
230th/ 347
METRIC RANK
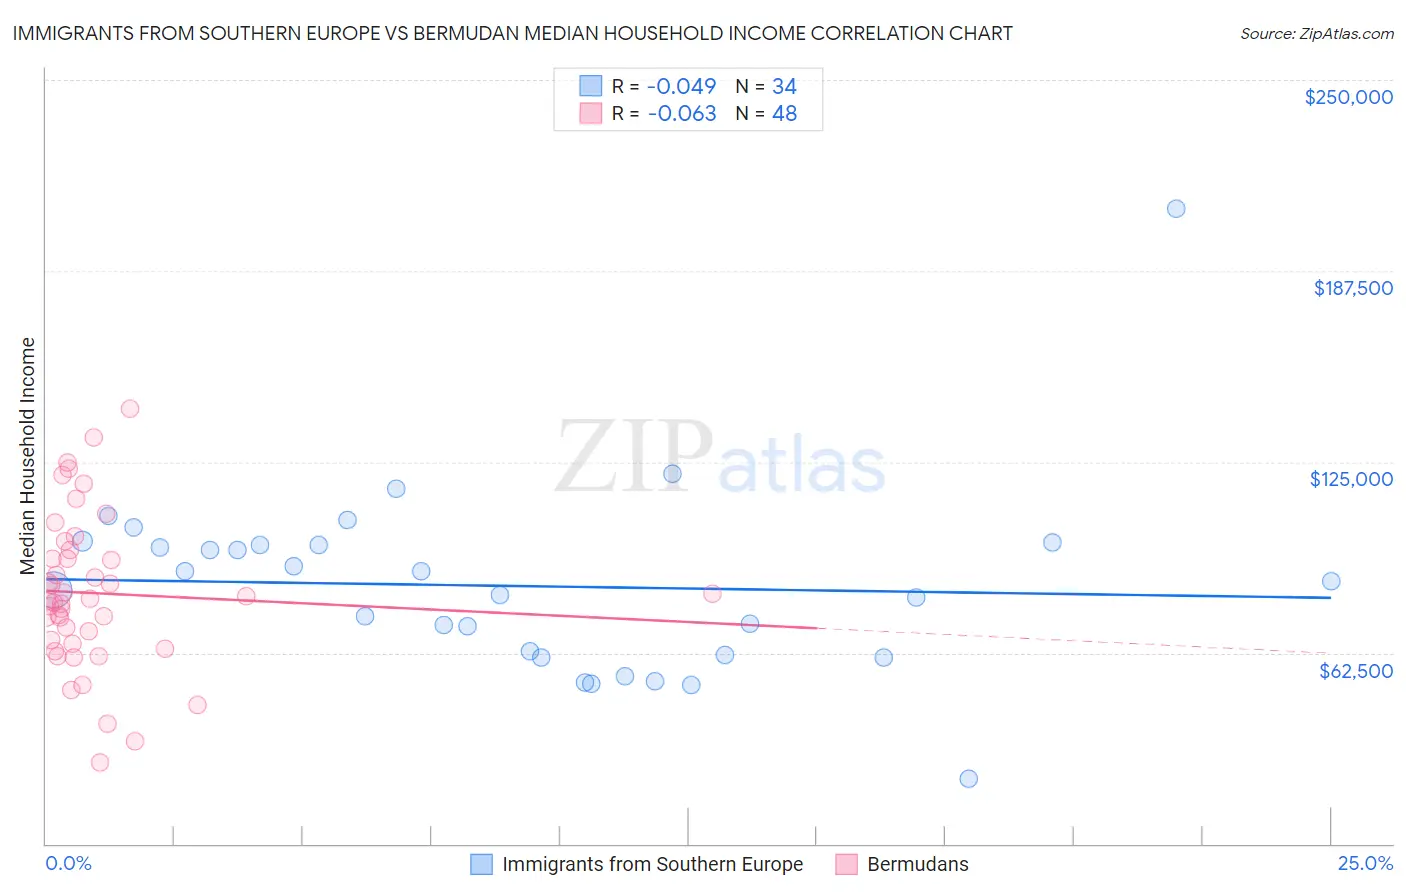
Immigrants from Southern Europe vs Bermudan Median Household Income Correlation Chart
The statistical analysis conducted on geographies consisting of 402,553,568 people shows no correlation between the proportion of Immigrants from Southern Europe and median household income in the United States with a correlation coefficient (R) of -0.049 and weighted average of $91,605. Similarly, the statistical analysis conducted on geographies consisting of 55,709,060 people shows a slight negative correlation between the proportion of Bermudans and median household income in the United States with a correlation coefficient (R) of -0.063 and weighted average of $80,406, a difference of 13.9%.
Median Household Income Correlation Summary
| Measurement | Immigrants from Southern Europe | Bermudan |
| Minimum | $21,344 | $26,741 |
| Maximum | $207,878 | $142,500 |
| Range | $186,534 | $115,759 |
| Mean | $84,332 | $82,030 |
| Median | $84,460 | $79,684 |
| Interquartile 25% (IQ1) | $61,987 | $65,991 |
| Interquartile 75% (IQ3) | $97,991 | $94,631 |
| Interquartile Range (IQR) | $36,004 | $28,640 |
| Standard Deviation (Sample) | $31,079 | $25,052 |
| Standard Deviation (Population) | $30,619 | $24,789 |
Similar Demographics by Median Household Income
Demographics Similar to Immigrants from Southern Europe by Median Household Income
In terms of median household income, the demographic groups most similar to Immigrants from Southern Europe are Immigrants from South Eastern Asia ($91,541, a difference of 0.070%), Immigrants from Serbia ($91,730, a difference of 0.14%), Ukrainian ($91,456, a difference of 0.16%), Immigrants from Moldova ($91,446, a difference of 0.17%), and Jordanian ($91,794, a difference of 0.21%).
| Demographics | Rating | Rank | Median Household Income |
| Immigrants | Vietnam | 98.8 /100 | #91 | Exceptional $91,987 |
| Immigrants | Western Europe | 98.8 /100 | #92 | Exceptional $91,936 |
| Immigrants | Lebanon | 98.7 /100 | #93 | Exceptional $91,887 |
| Immigrants | North America | 98.7 /100 | #94 | Exceptional $91,860 |
| Armenians | 98.7 /100 | #95 | Exceptional $91,807 |
| Jordanians | 98.7 /100 | #96 | Exceptional $91,794 |
| Immigrants | Serbia | 98.6 /100 | #97 | Exceptional $91,730 |
| Immigrants | Southern Europe | 98.5 /100 | #98 | Exceptional $91,605 |
| Immigrants | South Eastern Asia | 98.4 /100 | #99 | Exceptional $91,541 |
| Ukrainians | 98.3 /100 | #100 | Exceptional $91,456 |
| Immigrants | Moldova | 98.3 /100 | #101 | Exceptional $91,446 |
| Austrians | 98.2 /100 | #102 | Exceptional $91,339 |
| Immigrants | Ukraine | 98.0 /100 | #103 | Exceptional $91,124 |
| Immigrants | Kazakhstan | 97.8 /100 | #104 | Exceptional $91,015 |
| Immigrants | Brazil | 97.7 /100 | #105 | Exceptional $90,907 |
Demographics Similar to Bermudans by Median Household Income
In terms of median household income, the demographic groups most similar to Bermudans are Trinidadian and Tobagonian ($80,402, a difference of 0.010%), Immigrants from Trinidad and Tobago ($80,373, a difference of 0.040%), Immigrants from the Azores ($80,357, a difference of 0.060%), Immigrants from Ecuador ($80,341, a difference of 0.080%), and Immigrants from Guyana ($80,324, a difference of 0.10%).
| Demographics | Rating | Rank | Median Household Income |
| Immigrants | El Salvador | 7.6 /100 | #223 | Tragic $81,213 |
| Malaysians | 7.0 /100 | #224 | Tragic $81,064 |
| Scotch-Irish | 6.6 /100 | #225 | Tragic $80,972 |
| Immigrants | Panama | 6.2 /100 | #226 | Tragic $80,873 |
| Guyanese | 5.7 /100 | #227 | Tragic $80,734 |
| Immigrants | Bangladesh | 5.7 /100 | #228 | Tragic $80,722 |
| Delaware | 5.0 /100 | #229 | Tragic $80,527 |
| Bermudans | 4.7 /100 | #230 | Tragic $80,406 |
| Trinidadians and Tobagonians | 4.7 /100 | #231 | Tragic $80,402 |
| Immigrants | Trinidad and Tobago | 4.6 /100 | #232 | Tragic $80,373 |
| Immigrants | Azores | 4.5 /100 | #233 | Tragic $80,357 |
| Immigrants | Ecuador | 4.5 /100 | #234 | Tragic $80,341 |
| Immigrants | Guyana | 4.5 /100 | #235 | Tragic $80,324 |
| Immigrants | Bosnia and Herzegovina | 3.4 /100 | #236 | Tragic $79,888 |
| Nicaraguans | 3.1 /100 | #237 | Tragic $79,737 |