Immigrants from Hong Kong vs Tongan Median Household Income
COMPARE
Immigrants from Hong Kong
Tongan
Median Household Income
Median Household Income Comparison
Immigrants from Hong Kong
Tongans
$111,519
MEDIAN HOUSEHOLD INCOME
100.0/ 100
METRIC RATING
4th/ 347
METRIC RANK
$93,076
MEDIAN HOUSEHOLD INCOME
99.4/ 100
METRIC RATING
80th/ 347
METRIC RANK
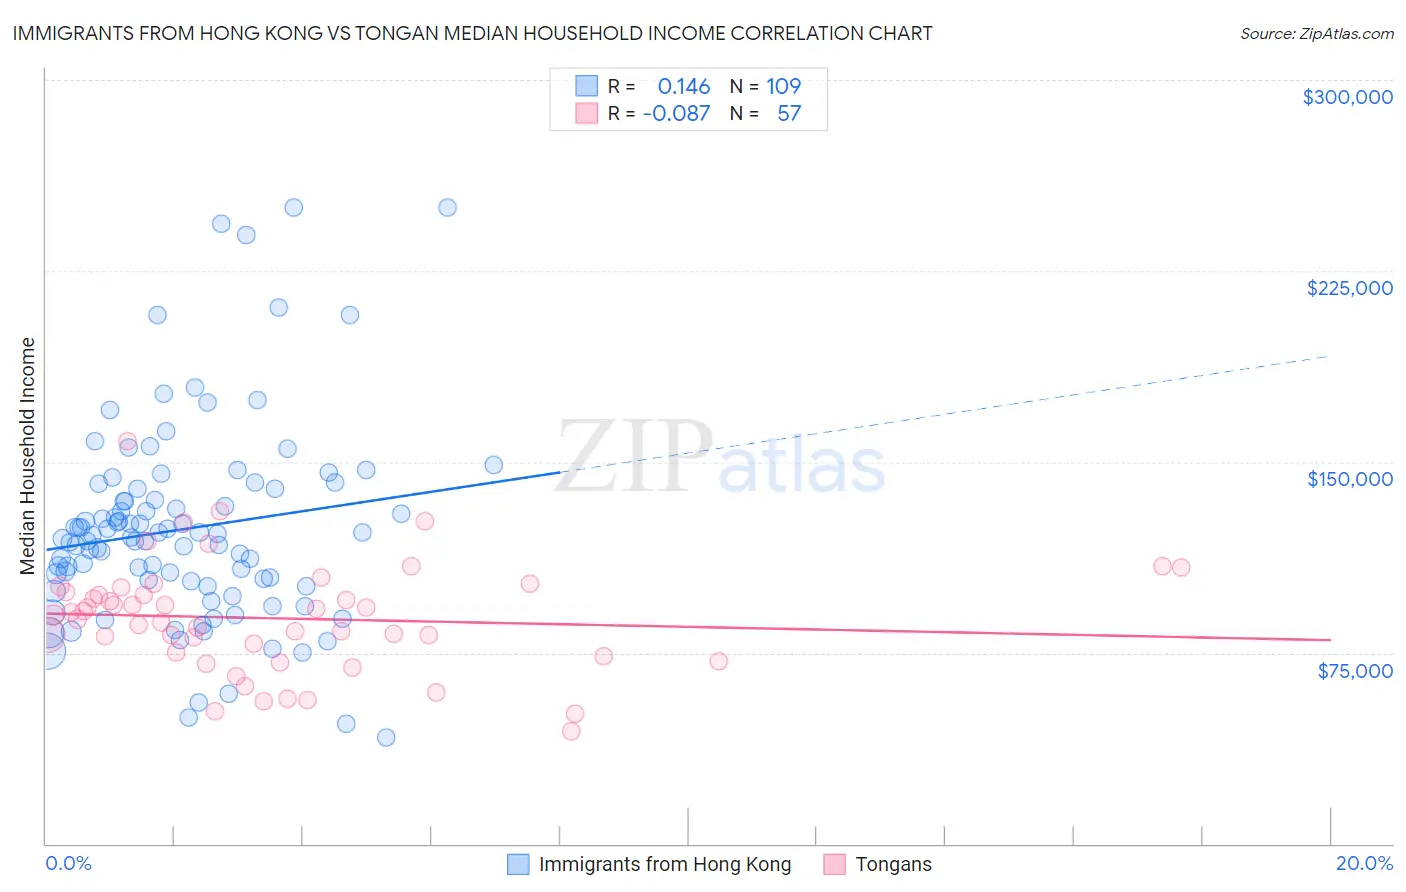
Immigrants from Hong Kong vs Tongan Median Household Income Correlation Chart
The statistical analysis conducted on geographies consisting of 253,858,060 people shows a poor positive correlation between the proportion of Immigrants from Hong Kong and median household income in the United States with a correlation coefficient (R) of 0.146 and weighted average of $111,519. Similarly, the statistical analysis conducted on geographies consisting of 102,857,692 people shows a slight negative correlation between the proportion of Tongans and median household income in the United States with a correlation coefficient (R) of -0.087 and weighted average of $93,076, a difference of 19.8%.
Median Household Income Correlation Summary
| Measurement | Immigrants from Hong Kong | Tongan |
| Minimum | $41,563 | $44,375 |
| Maximum | $250,001 | $157,875 |
| Range | $208,438 | $113,500 |
| Mean | $123,651 | $88,526 |
| Median | $120,226 | $89,840 |
| Interquartile 25% (IQ1) | $102,101 | $74,550 |
| Interquartile 75% (IQ3) | $139,539 | $99,865 |
| Interquartile Range (IQR) | $37,437 | $25,315 |
| Standard Deviation (Sample) | $39,253 | $21,499 |
| Standard Deviation (Population) | $39,072 | $21,310 |
Similar Demographics by Median Household Income
Demographics Similar to Immigrants from Hong Kong by Median Household Income
In terms of median household income, the demographic groups most similar to Immigrants from Hong Kong are Thai ($110,648, a difference of 0.79%), Immigrants from Singapore ($110,428, a difference of 0.99%), Immigrants from India ($113,009, a difference of 1.3%), Iranian ($109,835, a difference of 1.5%), and Immigrants from Iran ($108,055, a difference of 3.2%).
| Demographics | Rating | Rank | Median Household Income |
| Immigrants | Taiwan | 100.0 /100 | #1 | Exceptional $116,460 |
| Filipinos | 100.0 /100 | #2 | Exceptional $115,509 |
| Immigrants | India | 100.0 /100 | #3 | Exceptional $113,009 |
| Immigrants | Hong Kong | 100.0 /100 | #4 | Exceptional $111,519 |
| Thais | 100.0 /100 | #5 | Exceptional $110,648 |
| Immigrants | Singapore | 100.0 /100 | #6 | Exceptional $110,428 |
| Iranians | 100.0 /100 | #7 | Exceptional $109,835 |
| Immigrants | Iran | 100.0 /100 | #8 | Exceptional $108,055 |
| Okinawans | 100.0 /100 | #9 | Exceptional $106,624 |
| Immigrants | South Central Asia | 100.0 /100 | #10 | Exceptional $106,057 |
| Immigrants | China | 100.0 /100 | #11 | Exceptional $105,335 |
| Indians (Asian) | 100.0 /100 | #12 | Exceptional $105,262 |
| Immigrants | Eastern Asia | 100.0 /100 | #13 | Exceptional $104,796 |
| Immigrants | Ireland | 100.0 /100 | #14 | Exceptional $104,692 |
| Immigrants | Israel | 100.0 /100 | #15 | Exceptional $104,090 |
Demographics Similar to Tongans by Median Household Income
In terms of median household income, the demographic groups most similar to Tongans are Sri Lankan ($93,093, a difference of 0.020%), Immigrants from Eastern Europe ($93,051, a difference of 0.030%), Immigrants from Bulgaria ($93,148, a difference of 0.080%), Immigrants from Afghanistan ($93,375, a difference of 0.32%), and South African ($93,379, a difference of 0.33%).
| Demographics | Rating | Rank | Median Household Income |
| Immigrants | Egypt | 99.6 /100 | #73 | Exceptional $93,700 |
| Immigrants | Latvia | 99.6 /100 | #74 | Exceptional $93,602 |
| Immigrants | Italy | 99.5 /100 | #75 | Exceptional $93,465 |
| South Africans | 99.5 /100 | #76 | Exceptional $93,379 |
| Immigrants | Afghanistan | 99.5 /100 | #77 | Exceptional $93,375 |
| Immigrants | Bulgaria | 99.4 /100 | #78 | Exceptional $93,148 |
| Sri Lankans | 99.4 /100 | #79 | Exceptional $93,093 |
| Tongans | 99.4 /100 | #80 | Exceptional $93,076 |
| Immigrants | Eastern Europe | 99.4 /100 | #81 | Exceptional $93,051 |
| Immigrants | Spain | 99.3 /100 | #82 | Exceptional $92,732 |
| Italians | 99.1 /100 | #83 | Exceptional $92,475 |
| Immigrants | Argentina | 99.1 /100 | #84 | Exceptional $92,417 |
| Immigrants | Croatia | 99.0 /100 | #85 | Exceptional $92,225 |
| Immigrants | England | 98.9 /100 | #86 | Exceptional $92,098 |
| Immigrants | Hungary | 98.9 /100 | #87 | Exceptional $92,094 |