Immigrants from South Africa vs German Russian Child Poverty Among Boys Under 16
COMPARE
Immigrants from South Africa
German Russian
Child Poverty Among Boys Under 16
Child Poverty Among Boys Under 16 Comparison
Immigrants from South Africa
German Russians
14.8%
CHILD POVERTY AMONG BOYS UNDER 16
97.4/ 100
METRIC RATING
83rd/ 347
METRIC RANK
17.4%
CHILD POVERTY AMONG BOYS UNDER 16
10.9/ 100
METRIC RATING
206th/ 347
METRIC RANK
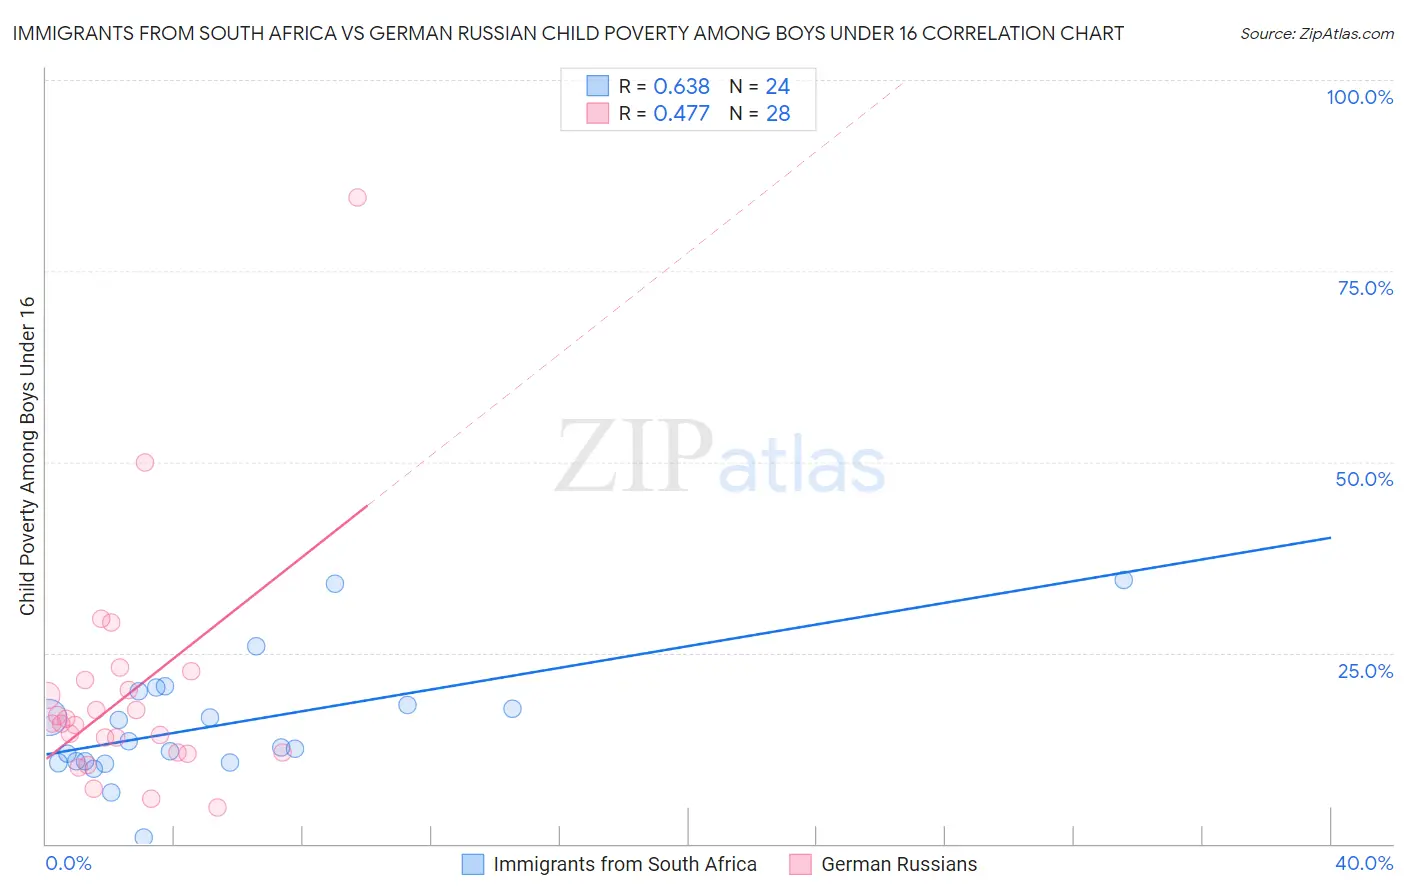
Immigrants from South Africa vs German Russian Child Poverty Among Boys Under 16 Correlation Chart
The statistical analysis conducted on geographies consisting of 230,169,492 people shows a significant positive correlation between the proportion of Immigrants from South Africa and poverty level among boys under the age of 16 in the United States with a correlation coefficient (R) of 0.638 and weighted average of 14.8%. Similarly, the statistical analysis conducted on geographies consisting of 95,990,905 people shows a moderate positive correlation between the proportion of German Russians and poverty level among boys under the age of 16 in the United States with a correlation coefficient (R) of 0.477 and weighted average of 17.4%, a difference of 17.8%.
Child Poverty Among Boys Under 16 Correlation Summary
| Measurement | Immigrants from South Africa | German Russian |
| Minimum | 0.79% | 4.7% |
| Maximum | 34.6% | 84.6% |
| Range | 33.8% | 79.9% |
| Mean | 15.6% | 19.5% |
| Median | 13.0% | 15.7% |
| Interquartile 25% (IQ1) | 10.8% | 12.0% |
| Interquartile 75% (IQ3) | 19.1% | 20.8% |
| Interquartile Range (IQR) | 8.3% | 8.8% |
| Standard Deviation (Sample) | 7.8% | 15.5% |
| Standard Deviation (Population) | 7.6% | 15.2% |
Similar Demographics by Child Poverty Among Boys Under 16
Demographics Similar to Immigrants from South Africa by Child Poverty Among Boys Under 16
In terms of child poverty among boys under 16, the demographic groups most similar to Immigrants from South Africa are Swiss (14.8%, a difference of 0.12%), Taiwanese (14.8%, a difference of 0.16%), Ukrainian (14.7%, a difference of 0.23%), German (14.8%, a difference of 0.23%), and Immigrants from Canada (14.7%, a difference of 0.26%).
| Demographics | Rating | Rank | Child Poverty Among Boys Under 16 |
| Immigrants | Croatia | 97.9 /100 | #76 | Exceptional 14.7% |
| Macedonians | 97.9 /100 | #77 | Exceptional 14.7% |
| Egyptians | 97.8 /100 | #78 | Exceptional 14.7% |
| Immigrants | Eastern Europe | 97.8 /100 | #79 | Exceptional 14.7% |
| Immigrants | Russia | 97.7 /100 | #80 | Exceptional 14.7% |
| Immigrants | Canada | 97.6 /100 | #81 | Exceptional 14.7% |
| Ukrainians | 97.6 /100 | #82 | Exceptional 14.7% |
| Immigrants | South Africa | 97.4 /100 | #83 | Exceptional 14.8% |
| Swiss | 97.3 /100 | #84 | Exceptional 14.8% |
| Taiwanese | 97.3 /100 | #85 | Exceptional 14.8% |
| Germans | 97.2 /100 | #86 | Exceptional 14.8% |
| Northern Europeans | 97.2 /100 | #87 | Exceptional 14.8% |
| Immigrants | North America | 97.1 /100 | #88 | Exceptional 14.8% |
| Immigrants | Argentina | 97.1 /100 | #89 | Exceptional 14.8% |
| Austrians | 97.1 /100 | #90 | Exceptional 14.8% |
Demographics Similar to German Russians by Child Poverty Among Boys Under 16
In terms of child poverty among boys under 16, the demographic groups most similar to German Russians are Immigrants from Portugal (17.4%, a difference of 0.060%), Ugandan (17.3%, a difference of 0.39%), Immigrants from Uzbekistan (17.3%, a difference of 0.59%), Immigrants from Sierra Leone (17.3%, a difference of 0.61%), and Immigrants from Afghanistan (17.3%, a difference of 0.68%).
| Demographics | Rating | Rank | Child Poverty Among Boys Under 16 |
| Delaware | 18.8 /100 | #199 | Poor 17.1% |
| Immigrants | Uruguay | 16.9 /100 | #200 | Poor 17.2% |
| Immigrants | Afghanistan | 13.7 /100 | #201 | Poor 17.3% |
| Immigrants | Sierra Leone | 13.4 /100 | #202 | Poor 17.3% |
| Immigrants | Uzbekistan | 13.3 /100 | #203 | Poor 17.3% |
| Ugandans | 12.5 /100 | #204 | Poor 17.3% |
| Immigrants | Portugal | 11.2 /100 | #205 | Poor 17.4% |
| German Russians | 10.9 /100 | #206 | Poor 17.4% |
| Immigrants | Thailand | 8.2 /100 | #207 | Tragic 17.5% |
| Malaysians | 7.6 /100 | #208 | Tragic 17.6% |
| Alaskan Athabascans | 7.3 /100 | #209 | Tragic 17.6% |
| Immigrants | Armenia | 6.8 /100 | #210 | Tragic 17.6% |
| Immigrants | Immigrants | 6.7 /100 | #211 | Tragic 17.6% |
| Aleuts | 6.6 /100 | #212 | Tragic 17.7% |
| Immigrants | Eastern Africa | 6.0 /100 | #213 | Tragic 17.7% |