Immigrants from South Africa vs Australian Median Female Earnings
COMPARE
Immigrants from South Africa
Australian
Median Female Earnings
Median Female Earnings Comparison
Immigrants from South Africa
Australians
$42,508
MEDIAN FEMALE EARNINGS
99.7/ 100
METRIC RATING
74th/ 347
METRIC RANK
$43,308
MEDIAN FEMALE EARNINGS
99.9/ 100
METRIC RATING
54th/ 347
METRIC RANK
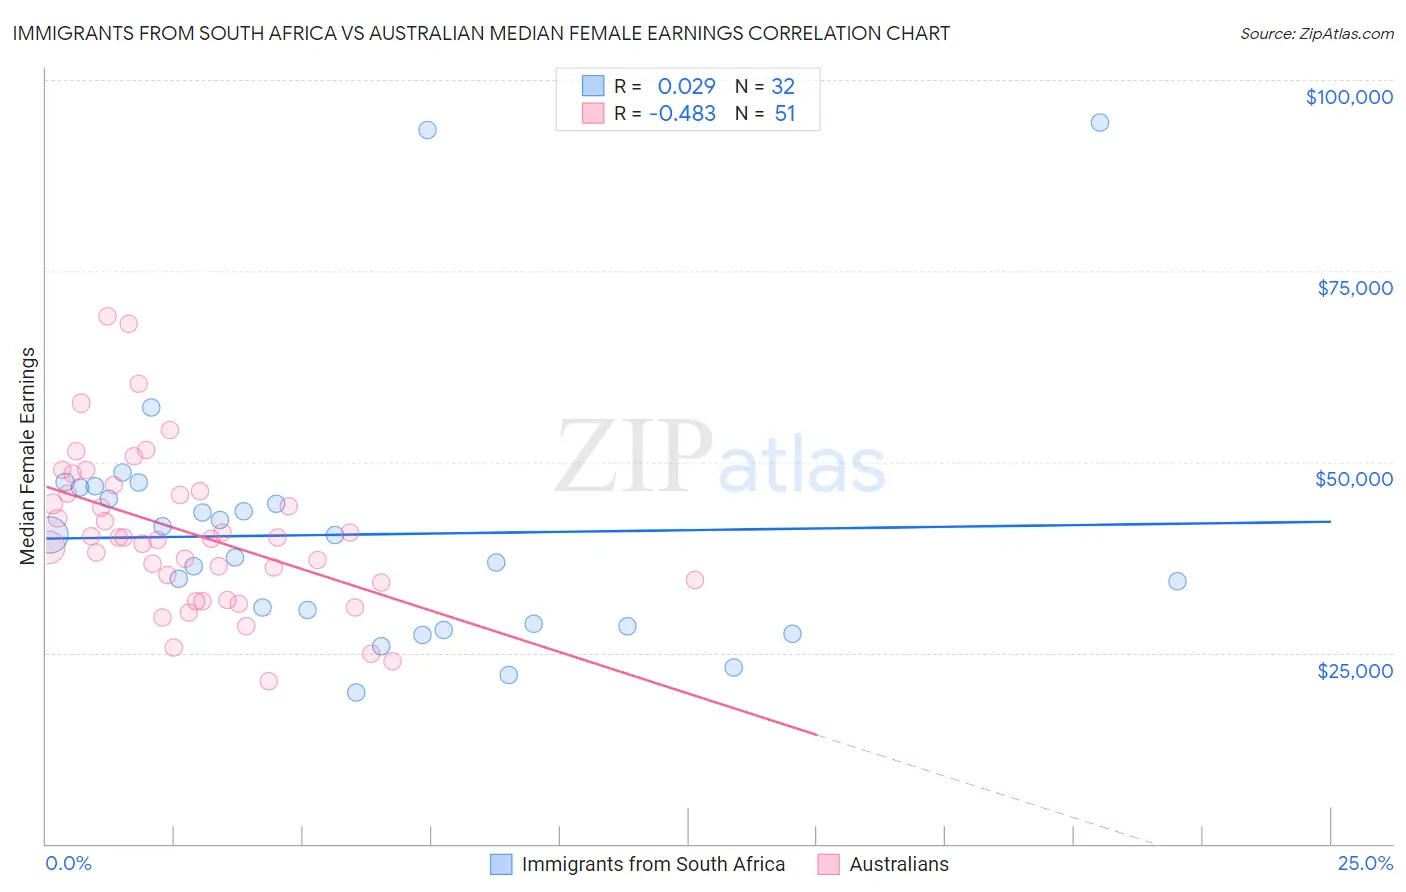
Immigrants from South Africa vs Australian Median Female Earnings Correlation Chart
The statistical analysis conducted on geographies consisting of 233,273,838 people shows no correlation between the proportion of Immigrants from South Africa and median female earnings in the United States with a correlation coefficient (R) of 0.029 and weighted average of $42,508. Similarly, the statistical analysis conducted on geographies consisting of 224,101,413 people shows a moderate negative correlation between the proportion of Australians and median female earnings in the United States with a correlation coefficient (R) of -0.483 and weighted average of $43,308, a difference of 1.9%.
Median Female Earnings Correlation Summary
| Measurement | Immigrants from South Africa | Australian |
| Minimum | $19,821 | $21,275 |
| Maximum | $94,510 | $69,107 |
| Range | $74,689 | $47,832 |
| Mean | $40,489 | $40,748 |
| Median | $38,975 | $40,021 |
| Interquartile 25% (IQ1) | $28,607 | $34,140 |
| Interquartile 75% (IQ3) | $45,877 | $46,088 |
| Interquartile Range (IQR) | $17,270 | $11,949 |
| Standard Deviation (Sample) | $16,714 | $10,236 |
| Standard Deviation (Population) | $16,451 | $10,135 |
Demographics Similar to Immigrants from South Africa and Australians by Median Female Earnings
In terms of median female earnings, the demographic groups most similar to Immigrants from South Africa are Mongolian ($42,542, a difference of 0.080%), Albanian ($42,584, a difference of 0.18%), Immigrants from Romania ($42,718, a difference of 0.50%), Immigrants from Ethiopia ($42,744, a difference of 0.56%), and Immigrants from Spain ($42,815, a difference of 0.72%). Similarly, the demographic groups most similar to Australians are Egyptian ($43,305, a difference of 0.010%), Immigrants from Croatia ($43,258, a difference of 0.11%), Ethiopian ($43,243, a difference of 0.15%), Paraguayan ($43,173, a difference of 0.31%), and Estonian ($43,106, a difference of 0.47%).
| Demographics | Rating | Rank | Median Female Earnings |
| Australians | 99.9 /100 | #54 | Exceptional $43,308 |
| Egyptians | 99.9 /100 | #55 | Exceptional $43,305 |
| Immigrants | Croatia | 99.9 /100 | #56 | Exceptional $43,258 |
| Ethiopians | 99.9 /100 | #57 | Exceptional $43,243 |
| Paraguayans | 99.9 /100 | #58 | Exceptional $43,173 |
| Estonians | 99.9 /100 | #59 | Exceptional $43,106 |
| Immigrants | Latvia | 99.9 /100 | #60 | Exceptional $43,099 |
| Immigrants | Bulgaria | 99.9 /100 | #61 | Exceptional $43,085 |
| Afghans | 99.9 /100 | #62 | Exceptional $43,077 |
| Immigrants | Ukraine | 99.9 /100 | #63 | Exceptional $43,069 |
| Immigrants | Pakistan | 99.9 /100 | #64 | Exceptional $43,052 |
| Sierra Leoneans | 99.9 /100 | #65 | Exceptional $42,868 |
| Immigrants | Norway | 99.9 /100 | #66 | Exceptional $42,837 |
| Immigrants | Egypt | 99.9 /100 | #67 | Exceptional $42,837 |
| Immigrants | Austria | 99.8 /100 | #68 | Exceptional $42,824 |
| Immigrants | Spain | 99.8 /100 | #69 | Exceptional $42,815 |
| Immigrants | Ethiopia | 99.8 /100 | #70 | Exceptional $42,744 |
| Immigrants | Romania | 99.8 /100 | #71 | Exceptional $42,718 |
| Albanians | 99.8 /100 | #72 | Exceptional $42,584 |
| Mongolians | 99.7 /100 | #73 | Exceptional $42,542 |
| Immigrants | South Africa | 99.7 /100 | #74 | Exceptional $42,508 |