Immigrants from Somalia vs Nigerian Per Capita Income
COMPARE
Immigrants from Somalia
Nigerian
Per Capita Income
Per Capita Income Comparison
Immigrants from Somalia
Nigerians
$39,974
PER CAPITA INCOME
1.6/ 100
METRIC RATING
247th/ 347
METRIC RANK
$41,026
PER CAPITA INCOME
4.9/ 100
METRIC RATING
229th/ 347
METRIC RANK
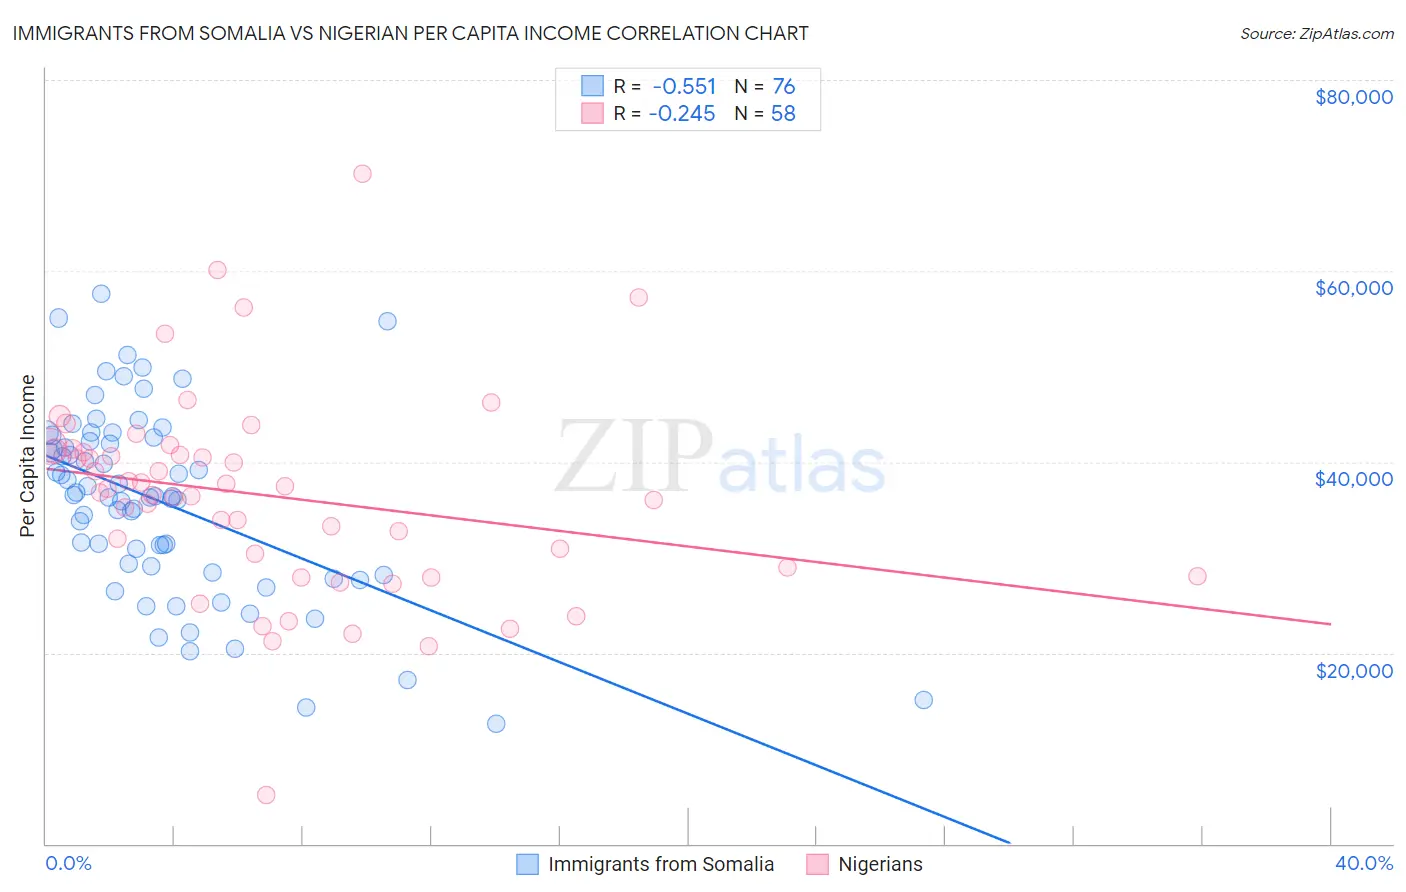
Immigrants from Somalia vs Nigerian Per Capita Income Correlation Chart
The statistical analysis conducted on geographies consisting of 92,111,755 people shows a substantial negative correlation between the proportion of Immigrants from Somalia and per capita income in the United States with a correlation coefficient (R) of -0.551 and weighted average of $39,974. Similarly, the statistical analysis conducted on geographies consisting of 332,796,588 people shows a weak negative correlation between the proportion of Nigerians and per capita income in the United States with a correlation coefficient (R) of -0.245 and weighted average of $41,026, a difference of 2.6%.
Per Capita Income Correlation Summary
| Measurement | Immigrants from Somalia | Nigerian |
| Minimum | $12,576 | $5,085 |
| Maximum | $57,592 | $70,186 |
| Range | $45,016 | $65,101 |
| Mean | $35,739 | $36,468 |
| Median | $36,374 | $37,024 |
| Interquartile 25% (IQ1) | $28,746 | $28,928 |
| Interquartile 75% (IQ3) | $42,371 | $41,176 |
| Interquartile Range (IQR) | $13,624 | $12,248 |
| Standard Deviation (Sample) | $9,785 | $10,721 |
| Standard Deviation (Population) | $9,721 | $10,628 |
Demographics Similar to Immigrants from Somalia and Nigerians by Per Capita Income
In terms of per capita income, the demographic groups most similar to Immigrants from Somalia are Cape Verdean ($39,935, a difference of 0.10%), Cree ($40,056, a difference of 0.20%), Subsaharan African ($40,152, a difference of 0.45%), French American Indian ($40,244, a difference of 0.67%), and German Russian ($40,266, a difference of 0.73%). Similarly, the demographic groups most similar to Nigerians are Native Hawaiian ($41,017, a difference of 0.020%), Senegalese ($41,000, a difference of 0.060%), Guyanese ($40,949, a difference of 0.19%), Immigrants from Grenada ($41,123, a difference of 0.24%), and Delaware ($40,778, a difference of 0.61%).
| Demographics | Rating | Rank | Per Capita Income |
| Immigrants | Grenada | 5.5 /100 | #228 | Tragic $41,123 |
| Nigerians | 4.9 /100 | #229 | Tragic $41,026 |
| Native Hawaiians | 4.9 /100 | #230 | Tragic $41,017 |
| Senegalese | 4.8 /100 | #231 | Tragic $41,000 |
| Guyanese | 4.5 /100 | #232 | Tragic $40,949 |
| Delaware | 3.8 /100 | #233 | Tragic $40,778 |
| Immigrants | West Indies | 3.7 /100 | #234 | Tragic $40,763 |
| Immigrants | Guyana | 3.6 /100 | #235 | Tragic $40,742 |
| Immigrants | Nonimmigrants | 3.4 /100 | #236 | Tragic $40,669 |
| Immigrants | Cambodia | 2.6 /100 | #237 | Tragic $40,434 |
| Somalis | 2.4 /100 | #238 | Tragic $40,367 |
| Tsimshian | 2.4 /100 | #239 | Tragic $40,344 |
| Immigrants | Nigeria | 2.3 /100 | #240 | Tragic $40,339 |
| British West Indians | 2.3 /100 | #241 | Tragic $40,330 |
| Immigrants | Western Africa | 2.2 /100 | #242 | Tragic $40,294 |
| German Russians | 2.2 /100 | #243 | Tragic $40,266 |
| French American Indians | 2.1 /100 | #244 | Tragic $40,244 |
| Sub-Saharan Africans | 1.9 /100 | #245 | Tragic $40,152 |
| Cree | 1.7 /100 | #246 | Tragic $40,056 |
| Immigrants | Somalia | 1.6 /100 | #247 | Tragic $39,974 |
| Cape Verdeans | 1.5 /100 | #248 | Tragic $39,935 |