Immigrants from Somalia vs Syrian Per Capita Income
COMPARE
Immigrants from Somalia
Syrian
Per Capita Income
Per Capita Income Comparison
Immigrants from Somalia
Syrians
$39,974
PER CAPITA INCOME
1.6/ 100
METRIC RATING
247th/ 347
METRIC RANK
$46,837
PER CAPITA INCOME
97.2/ 100
METRIC RATING
103rd/ 347
METRIC RANK
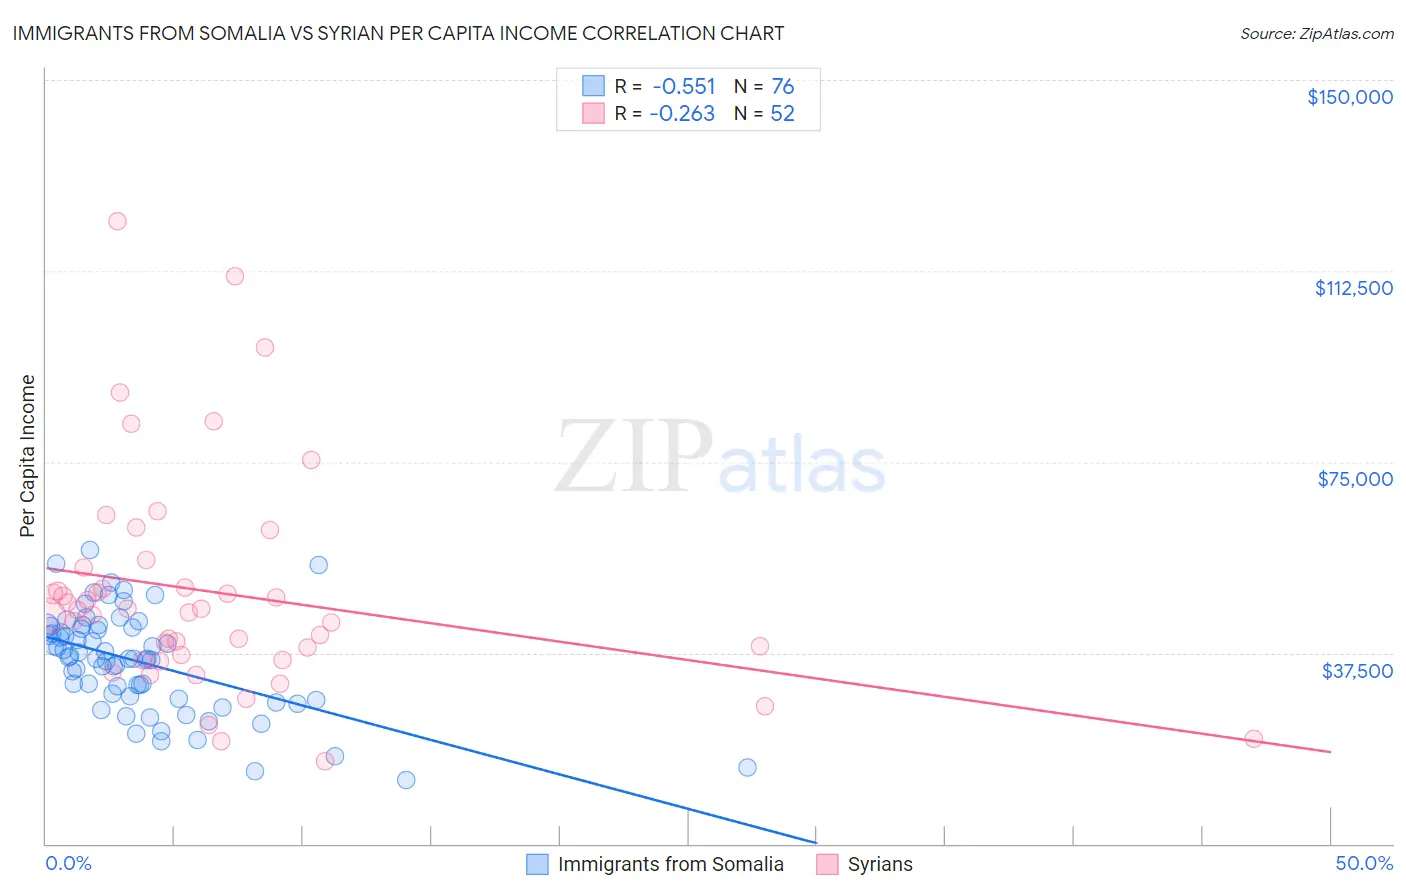
Immigrants from Somalia vs Syrian Per Capita Income Correlation Chart
The statistical analysis conducted on geographies consisting of 92,111,755 people shows a substantial negative correlation between the proportion of Immigrants from Somalia and per capita income in the United States with a correlation coefficient (R) of -0.551 and weighted average of $39,974. Similarly, the statistical analysis conducted on geographies consisting of 266,332,251 people shows a weak negative correlation between the proportion of Syrians and per capita income in the United States with a correlation coefficient (R) of -0.263 and weighted average of $46,837, a difference of 17.2%.
Per Capita Income Correlation Summary
| Measurement | Immigrants from Somalia | Syrian |
| Minimum | $12,576 | $16,296 |
| Maximum | $57,592 | $122,379 |
| Range | $45,016 | $106,083 |
| Mean | $35,739 | $49,326 |
| Median | $36,374 | $45,708 |
| Interquartile 25% (IQ1) | $28,746 | $36,580 |
| Interquartile 75% (IQ3) | $42,371 | $52,298 |
| Interquartile Range (IQR) | $13,624 | $15,717 |
| Standard Deviation (Sample) | $9,785 | $21,603 |
| Standard Deviation (Population) | $9,721 | $21,394 |
Similar Demographics by Per Capita Income
Demographics Similar to Immigrants from Somalia by Per Capita Income
In terms of per capita income, the demographic groups most similar to Immigrants from Somalia are Cape Verdean ($39,935, a difference of 0.10%), Cree ($40,056, a difference of 0.20%), Japanese ($39,870, a difference of 0.26%), Immigrants from Burma/Myanmar ($39,827, a difference of 0.37%), and Samoan ($39,826, a difference of 0.37%).
| Demographics | Rating | Rank | Per Capita Income |
| Immigrants | Nigeria | 2.3 /100 | #240 | Tragic $40,339 |
| British West Indians | 2.3 /100 | #241 | Tragic $40,330 |
| Immigrants | Western Africa | 2.2 /100 | #242 | Tragic $40,294 |
| German Russians | 2.2 /100 | #243 | Tragic $40,266 |
| French American Indians | 2.1 /100 | #244 | Tragic $40,244 |
| Sub-Saharan Africans | 1.9 /100 | #245 | Tragic $40,152 |
| Cree | 1.7 /100 | #246 | Tragic $40,056 |
| Immigrants | Somalia | 1.6 /100 | #247 | Tragic $39,974 |
| Cape Verdeans | 1.5 /100 | #248 | Tragic $39,935 |
| Japanese | 1.4 /100 | #249 | Tragic $39,870 |
| Immigrants | Burma/Myanmar | 1.3 /100 | #250 | Tragic $39,827 |
| Samoans | 1.3 /100 | #251 | Tragic $39,826 |
| Immigrants | Azores | 1.0 /100 | #252 | Tragic $39,608 |
| Osage | 1.0 /100 | #253 | Tragic $39,568 |
| Alaska Natives | 1.0 /100 | #254 | Tragic $39,558 |
Demographics Similar to Syrians by Per Capita Income
In terms of per capita income, the demographic groups most similar to Syrians are Immigrants from Western Asia ($46,876, a difference of 0.080%), Immigrants from Uzbekistan ($46,929, a difference of 0.20%), Immigrants from Lebanon ($46,938, a difference of 0.22%), Brazilian ($46,700, a difference of 0.29%), and Laotian ($47,041, a difference of 0.43%).
| Demographics | Rating | Rank | Per Capita Income |
| Alsatians | 98.3 /100 | #96 | Exceptional $47,284 |
| Carpatho Rusyns | 98.2 /100 | #97 | Exceptional $47,248 |
| Immigrants | Pakistan | 97.9 /100 | #98 | Exceptional $47,084 |
| Laotians | 97.8 /100 | #99 | Exceptional $47,041 |
| Immigrants | Lebanon | 97.5 /100 | #100 | Exceptional $46,938 |
| Immigrants | Uzbekistan | 97.5 /100 | #101 | Exceptional $46,929 |
| Immigrants | Western Asia | 97.4 /100 | #102 | Exceptional $46,876 |
| Syrians | 97.2 /100 | #103 | Exceptional $46,837 |
| Brazilians | 96.8 /100 | #104 | Exceptional $46,700 |
| British | 96.3 /100 | #105 | Exceptional $46,571 |
| Ethiopians | 96.3 /100 | #106 | Exceptional $46,569 |
| Serbians | 96.2 /100 | #107 | Exceptional $46,551 |
| Immigrants | Kuwait | 96.2 /100 | #108 | Exceptional $46,543 |
| Immigrants | Northern Africa | 96.2 /100 | #109 | Exceptional $46,531 |
| Chileans | 95.9 /100 | #110 | Exceptional $46,459 |