Immigrants from Caribbean vs Estonian Householder Income Ages 25 - 44 years
COMPARE
Immigrants from Caribbean
Estonian
Householder Income Ages 25 - 44 years
Householder Income Ages 25 - 44 years Comparison
Immigrants from Caribbean
Estonians
$80,326
HOUSEHOLDER INCOME AGES 25 - 44 YEARS
0.0/ 100
METRIC RATING
304th/ 347
METRIC RANK
$107,269
HOUSEHOLDER INCOME AGES 25 - 44 YEARS
99.9/ 100
METRIC RATING
47th/ 347
METRIC RANK
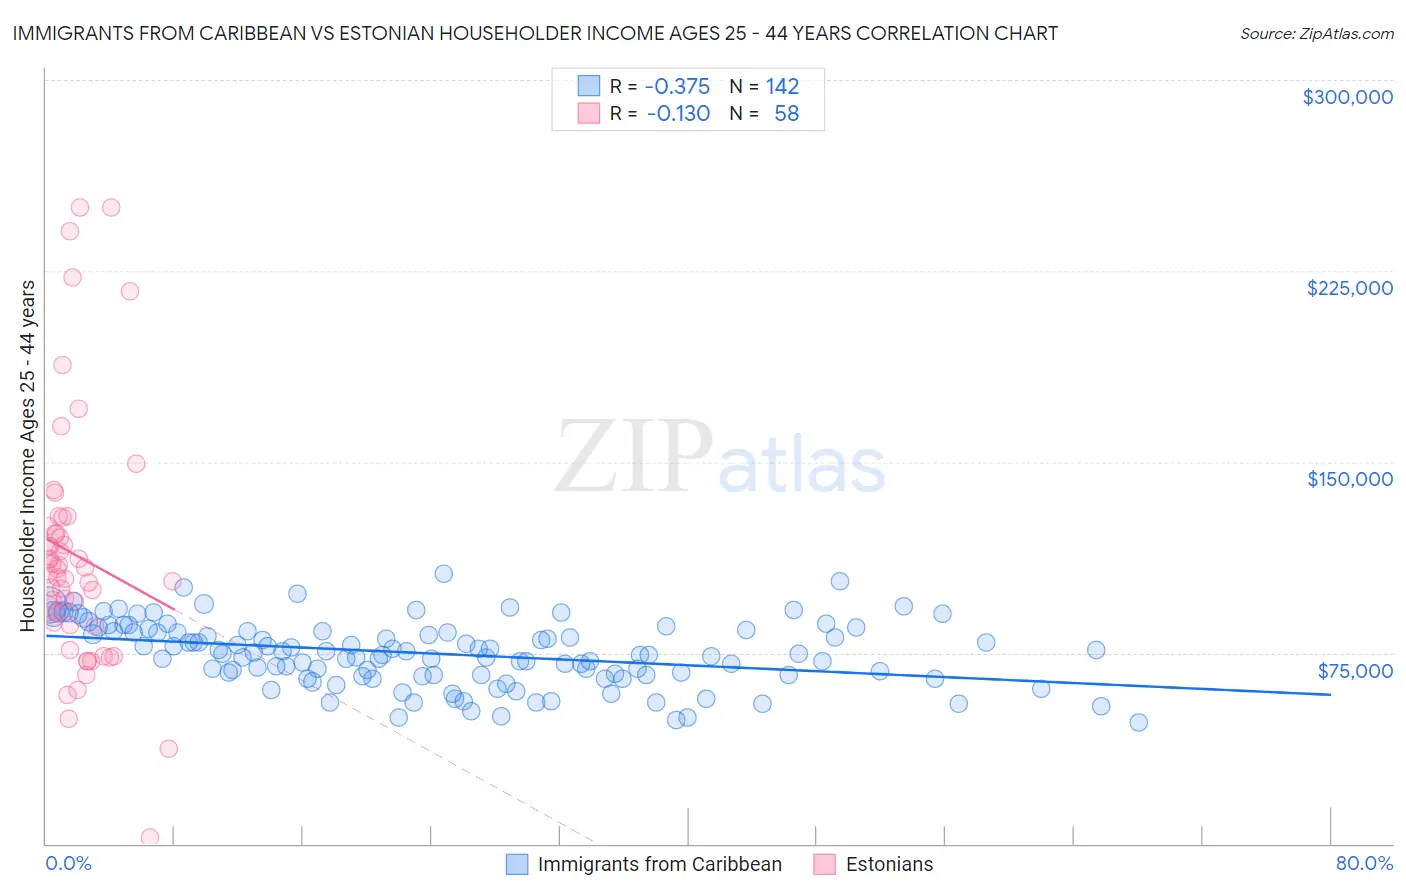
Immigrants from Caribbean vs Estonian Householder Income Ages 25 - 44 years Correlation Chart
The statistical analysis conducted on geographies consisting of 448,247,507 people shows a mild negative correlation between the proportion of Immigrants from Caribbean and household income with householder between the ages 25 and 44 in the United States with a correlation coefficient (R) of -0.375 and weighted average of $80,326. Similarly, the statistical analysis conducted on geographies consisting of 123,375,141 people shows a poor negative correlation between the proportion of Estonians and household income with householder between the ages 25 and 44 in the United States with a correlation coefficient (R) of -0.130 and weighted average of $107,269, a difference of 33.5%.
Householder Income Ages 25 - 44 years Correlation Summary
| Measurement | Immigrants from Caribbean | Estonian |
| Minimum | $47,510 | $2,499 |
| Maximum | $105,938 | $250,001 |
| Range | $58,428 | $247,502 |
| Mean | $74,665 | $113,361 |
| Median | $74,621 | $106,893 |
| Interquartile 25% (IQ1) | $66,150 | $85,980 |
| Interquartile 75% (IQ3) | $83,625 | $124,694 |
| Interquartile Range (IQR) | $17,475 | $38,714 |
| Standard Deviation (Sample) | $12,546 | $49,215 |
| Standard Deviation (Population) | $12,502 | $48,789 |
Similar Demographics by Householder Income Ages 25 - 44 years
Demographics Similar to Immigrants from Caribbean by Householder Income Ages 25 - 44 years
In terms of householder income ages 25 - 44 years, the demographic groups most similar to Immigrants from Caribbean are Immigrants from Dominican Republic ($80,319, a difference of 0.010%), Apache ($80,260, a difference of 0.080%), Mexican ($80,427, a difference of 0.13%), Hispanic or Latino ($80,515, a difference of 0.24%), and Immigrants from Micronesia ($80,544, a difference of 0.27%).
| Demographics | Rating | Rank | Householder Income Ages 25 - 44 years |
| Immigrants | Guatemala | 0.1 /100 | #297 | Tragic $81,341 |
| Dominicans | 0.1 /100 | #298 | Tragic $81,229 |
| Immigrants | Liberia | 0.1 /100 | #299 | Tragic $80,863 |
| Cherokee | 0.0 /100 | #300 | Tragic $80,843 |
| Immigrants | Micronesia | 0.0 /100 | #301 | Tragic $80,544 |
| Hispanics or Latinos | 0.0 /100 | #302 | Tragic $80,515 |
| Mexicans | 0.0 /100 | #303 | Tragic $80,427 |
| Immigrants | Caribbean | 0.0 /100 | #304 | Tragic $80,326 |
| Immigrants | Dominican Republic | 0.0 /100 | #305 | Tragic $80,319 |
| Apache | 0.0 /100 | #306 | Tragic $80,260 |
| Haitians | 0.0 /100 | #307 | Tragic $80,055 |
| Immigrants | Central America | 0.0 /100 | #308 | Tragic $80,012 |
| Chippewa | 0.0 /100 | #309 | Tragic $80,005 |
| Fijians | 0.0 /100 | #310 | Tragic $79,956 |
| Indonesians | 0.0 /100 | #311 | Tragic $79,543 |
Demographics Similar to Estonians by Householder Income Ages 25 - 44 years
In terms of householder income ages 25 - 44 years, the demographic groups most similar to Estonians are Bulgarian ($107,264, a difference of 0.010%), Immigrants from Turkey ($107,258, a difference of 0.010%), Cambodian ($107,148, a difference of 0.11%), Immigrants from Belarus ($107,393, a difference of 0.12%), and Israeli ($107,579, a difference of 0.29%).
| Demographics | Rating | Rank | Householder Income Ages 25 - 44 years |
| Immigrants | Lithuania | 99.9 /100 | #40 | Exceptional $108,149 |
| Immigrants | Bolivia | 99.9 /100 | #41 | Exceptional $108,128 |
| Australians | 99.9 /100 | #42 | Exceptional $107,912 |
| Immigrants | Malaysia | 99.9 /100 | #43 | Exceptional $107,650 |
| Immigrants | Indonesia | 99.9 /100 | #44 | Exceptional $107,627 |
| Israelis | 99.9 /100 | #45 | Exceptional $107,579 |
| Immigrants | Belarus | 99.9 /100 | #46 | Exceptional $107,393 |
| Estonians | 99.9 /100 | #47 | Exceptional $107,269 |
| Bulgarians | 99.9 /100 | #48 | Exceptional $107,264 |
| Immigrants | Turkey | 99.9 /100 | #49 | Exceptional $107,258 |
| Cambodians | 99.9 /100 | #50 | Exceptional $107,148 |
| Immigrants | Czechoslovakia | 99.9 /100 | #51 | Exceptional $106,888 |
| Immigrants | Europe | 99.9 /100 | #52 | Exceptional $106,817 |
| Immigrants | Norway | 99.9 /100 | #53 | Exceptional $106,629 |
| Paraguayans | 99.9 /100 | #54 | Exceptional $106,615 |