Macedonian vs Estonian Householder Income Ages 25 - 44 years
COMPARE
Macedonian
Estonian
Householder Income Ages 25 - 44 years
Householder Income Ages 25 - 44 years Comparison
Macedonians
Estonians
$101,882
HOUSEHOLDER INCOME AGES 25 - 44 YEARS
98.3/ 100
METRIC RATING
96th/ 347
METRIC RANK
$107,269
HOUSEHOLDER INCOME AGES 25 - 44 YEARS
99.9/ 100
METRIC RATING
47th/ 347
METRIC RANK
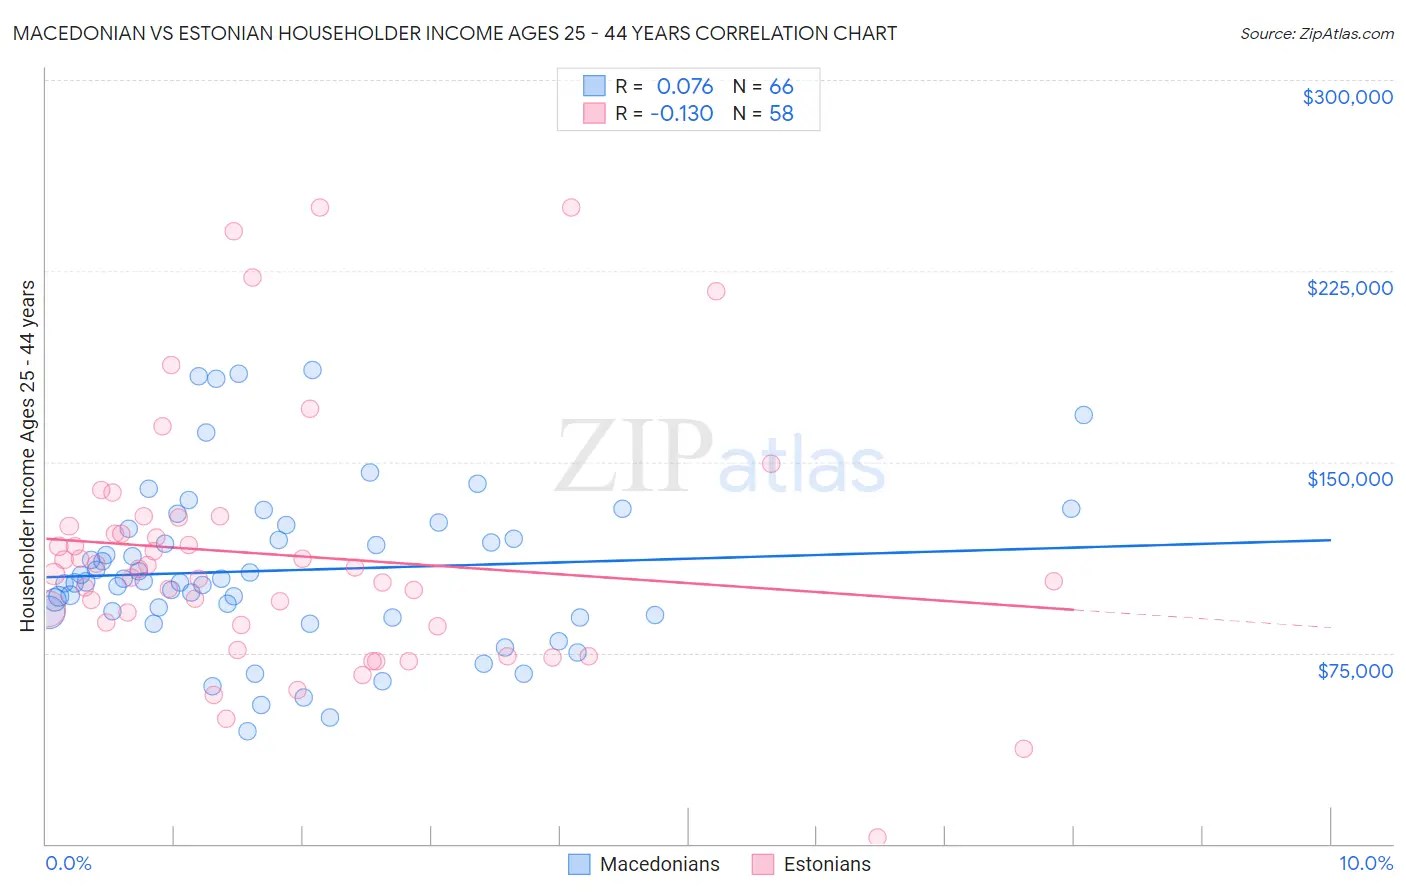
Macedonian vs Estonian Householder Income Ages 25 - 44 years Correlation Chart
The statistical analysis conducted on geographies consisting of 132,531,102 people shows a slight positive correlation between the proportion of Macedonians and household income with householder between the ages 25 and 44 in the United States with a correlation coefficient (R) of 0.076 and weighted average of $101,882. Similarly, the statistical analysis conducted on geographies consisting of 123,375,141 people shows a poor negative correlation between the proportion of Estonians and household income with householder between the ages 25 and 44 in the United States with a correlation coefficient (R) of -0.130 and weighted average of $107,269, a difference of 5.3%.
Householder Income Ages 25 - 44 years Correlation Summary
| Measurement | Macedonian | Estonian |
| Minimum | $44,379 | $2,499 |
| Maximum | $185,978 | $250,001 |
| Range | $141,599 | $247,502 |
| Mean | $107,344 | $113,361 |
| Median | $103,107 | $106,893 |
| Interquartile 25% (IQ1) | $89,835 | $85,980 |
| Interquartile 75% (IQ3) | $123,584 | $124,694 |
| Interquartile Range (IQR) | $33,749 | $38,714 |
| Standard Deviation (Sample) | $31,913 | $49,215 |
| Standard Deviation (Population) | $31,670 | $48,789 |
Similar Demographics by Householder Income Ages 25 - 44 years
Demographics Similar to Macedonians by Householder Income Ages 25 - 44 years
In terms of householder income ages 25 - 44 years, the demographic groups most similar to Macedonians are Austrian ($101,842, a difference of 0.040%), Assyrian/Chaldean/Syriac ($101,936, a difference of 0.050%), Sri Lankan ($101,960, a difference of 0.080%), Immigrants from England ($102,020, a difference of 0.14%), and Immigrants from Kazakhstan ($101,727, a difference of 0.15%).
| Demographics | Rating | Rank | Householder Income Ages 25 - 44 years |
| Romanians | 98.8 /100 | #89 | Exceptional $102,544 |
| Ukrainians | 98.8 /100 | #90 | Exceptional $102,451 |
| Croatians | 98.7 /100 | #91 | Exceptional $102,414 |
| Immigrants | North America | 98.7 /100 | #92 | Exceptional $102,407 |
| Immigrants | England | 98.4 /100 | #93 | Exceptional $102,020 |
| Sri Lankans | 98.4 /100 | #94 | Exceptional $101,960 |
| Assyrians/Chaldeans/Syriacs | 98.3 /100 | #95 | Exceptional $101,936 |
| Macedonians | 98.3 /100 | #96 | Exceptional $101,882 |
| Austrians | 98.3 /100 | #97 | Exceptional $101,842 |
| Immigrants | Kazakhstan | 98.1 /100 | #98 | Exceptional $101,727 |
| Taiwanese | 97.9 /100 | #99 | Exceptional $101,492 |
| Immigrants | Argentina | 97.8 /100 | #100 | Exceptional $101,415 |
| Albanians | 97.8 /100 | #101 | Exceptional $101,367 |
| Immigrants | Lebanon | 97.4 /100 | #102 | Exceptional $101,124 |
| Immigrants | Moldova | 97.4 /100 | #103 | Exceptional $101,091 |
Demographics Similar to Estonians by Householder Income Ages 25 - 44 years
In terms of householder income ages 25 - 44 years, the demographic groups most similar to Estonians are Bulgarian ($107,264, a difference of 0.010%), Immigrants from Turkey ($107,258, a difference of 0.010%), Cambodian ($107,148, a difference of 0.11%), Immigrants from Belarus ($107,393, a difference of 0.12%), and Israeli ($107,579, a difference of 0.29%).
| Demographics | Rating | Rank | Householder Income Ages 25 - 44 years |
| Immigrants | Lithuania | 99.9 /100 | #40 | Exceptional $108,149 |
| Immigrants | Bolivia | 99.9 /100 | #41 | Exceptional $108,128 |
| Australians | 99.9 /100 | #42 | Exceptional $107,912 |
| Immigrants | Malaysia | 99.9 /100 | #43 | Exceptional $107,650 |
| Immigrants | Indonesia | 99.9 /100 | #44 | Exceptional $107,627 |
| Israelis | 99.9 /100 | #45 | Exceptional $107,579 |
| Immigrants | Belarus | 99.9 /100 | #46 | Exceptional $107,393 |
| Estonians | 99.9 /100 | #47 | Exceptional $107,269 |
| Bulgarians | 99.9 /100 | #48 | Exceptional $107,264 |
| Immigrants | Turkey | 99.9 /100 | #49 | Exceptional $107,258 |
| Cambodians | 99.9 /100 | #50 | Exceptional $107,148 |
| Immigrants | Czechoslovakia | 99.9 /100 | #51 | Exceptional $106,888 |
| Immigrants | Europe | 99.9 /100 | #52 | Exceptional $106,817 |
| Immigrants | Norway | 99.9 /100 | #53 | Exceptional $106,629 |
| Paraguayans | 99.9 /100 | #54 | Exceptional $106,615 |