Immigrants from Serbia vs Asian Unemployment Among Women with Children Under 6 years
COMPARE
Immigrants from Serbia
Asian
Unemployment Among Women with Children Under 6 years
Unemployment Among Women with Children Under 6 years Comparison
Immigrants from Serbia
Asians
6.9%
UNEMPLOYMENT AMONG WOMEN WITH CHILDREN UNDER 6 YEARS
99.8/ 100
METRIC RATING
59th/ 347
METRIC RANK
6.7%
UNEMPLOYMENT AMONG WOMEN WITH CHILDREN UNDER 6 YEARS
100.0/ 100
METRIC RATING
40th/ 347
METRIC RANK
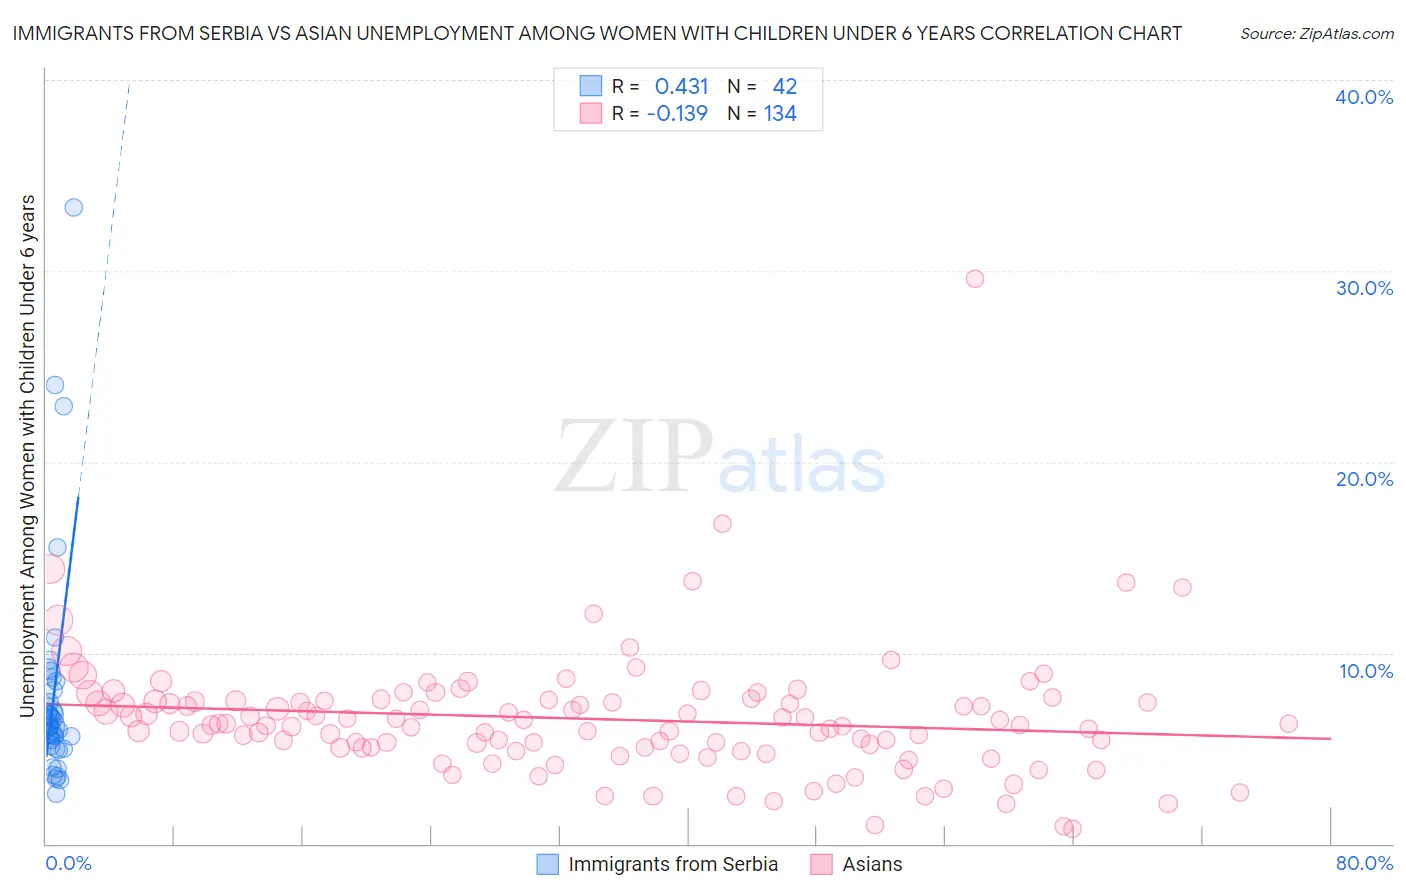
Immigrants from Serbia vs Asian Unemployment Among Women with Children Under 6 years Correlation Chart
The statistical analysis conducted on geographies consisting of 114,667,265 people shows a moderate positive correlation between the proportion of Immigrants from Serbia and unemployment rate among women with children under the age of 6 in the United States with a correlation coefficient (R) of 0.431 and weighted average of 6.9%. Similarly, the statistical analysis conducted on geographies consisting of 374,627,418 people shows a poor negative correlation between the proportion of Asians and unemployment rate among women with children under the age of 6 in the United States with a correlation coefficient (R) of -0.139 and weighted average of 6.7%, a difference of 3.0%.
Unemployment Among Women with Children Under 6 years Correlation Summary
| Measurement | Immigrants from Serbia | Asian |
| Minimum | 2.6% | 0.80% |
| Maximum | 33.3% | 29.6% |
| Range | 30.7% | 28.8% |
| Mean | 7.8% | 6.5% |
| Median | 6.2% | 6.3% |
| Interquartile 25% (IQ1) | 5.1% | 5.0% |
| Interquartile 75% (IQ3) | 8.1% | 7.5% |
| Interquartile Range (IQR) | 2.9% | 2.5% |
| Standard Deviation (Sample) | 5.9% | 3.3% |
| Standard Deviation (Population) | 5.8% | 3.3% |
Demographics Similar to Immigrants from Serbia and Asians by Unemployment Among Women with Children Under 6 years
In terms of unemployment among women with children under 6 years, the demographic groups most similar to Immigrants from Serbia are Immigrants from Turkey (6.9%, a difference of 0.070%), Icelander (6.9%, a difference of 0.29%), Immigrants from Ethiopia (6.9%, a difference of 0.30%), Immigrants from Ukraine (6.8%, a difference of 0.40%), and Immigrants from Latvia (6.8%, a difference of 0.90%). Similarly, the demographic groups most similar to Asians are Immigrants from Indonesia (6.7%, a difference of 0.16%), Immigrants from Russia (6.7%, a difference of 0.22%), Immigrants from Cuba (6.7%, a difference of 0.26%), Bhutanese (6.7%, a difference of 0.54%), and Iranian (6.7%, a difference of 1.1%).
| Demographics | Rating | Rank | Unemployment Among Women with Children Under 6 years |
| Immigrants | Russia | 100.0 /100 | #39 | Exceptional 6.7% |
| Asians | 100.0 /100 | #40 | Exceptional 6.7% |
| Immigrants | Indonesia | 99.9 /100 | #41 | Exceptional 6.7% |
| Immigrants | Cuba | 99.9 /100 | #42 | Exceptional 6.7% |
| Bhutanese | 99.9 /100 | #43 | Exceptional 6.7% |
| Iranians | 99.9 /100 | #44 | Exceptional 6.7% |
| Immigrants | Australia | 99.9 /100 | #45 | Exceptional 6.8% |
| Latvians | 99.9 /100 | #46 | Exceptional 6.8% |
| Immigrants | Asia | 99.9 /100 | #47 | Exceptional 6.8% |
| Immigrants | Switzerland | 99.9 /100 | #48 | Exceptional 6.8% |
| Immigrants | Nepal | 99.9 /100 | #49 | Exceptional 6.8% |
| Immigrants | Ireland | 99.9 /100 | #50 | Exceptional 6.8% |
| Ethiopians | 99.9 /100 | #51 | Exceptional 6.8% |
| Immigrants | Iran | 99.9 /100 | #52 | Exceptional 6.8% |
| Chinese | 99.9 /100 | #53 | Exceptional 6.8% |
| Immigrants | Latvia | 99.9 /100 | #54 | Exceptional 6.8% |
| Immigrants | Ukraine | 99.8 /100 | #55 | Exceptional 6.8% |
| Immigrants | Ethiopia | 99.8 /100 | #56 | Exceptional 6.9% |
| Icelanders | 99.8 /100 | #57 | Exceptional 6.9% |
| Immigrants | Turkey | 99.8 /100 | #58 | Exceptional 6.9% |
| Immigrants | Serbia | 99.8 /100 | #59 | Exceptional 6.9% |