Immigrants from Serbia vs Immigrants from Dominica Per Capita Income
COMPARE
Immigrants from Serbia
Immigrants from Dominica
Per Capita Income
Per Capita Income Comparison
Immigrants from Serbia
Immigrants from Dominica
$50,810
PER CAPITA INCOME
100.0/ 100
METRIC RATING
48th/ 347
METRIC RANK
$37,952
PER CAPITA INCOME
0.2/ 100
METRIC RATING
281st/ 347
METRIC RANK
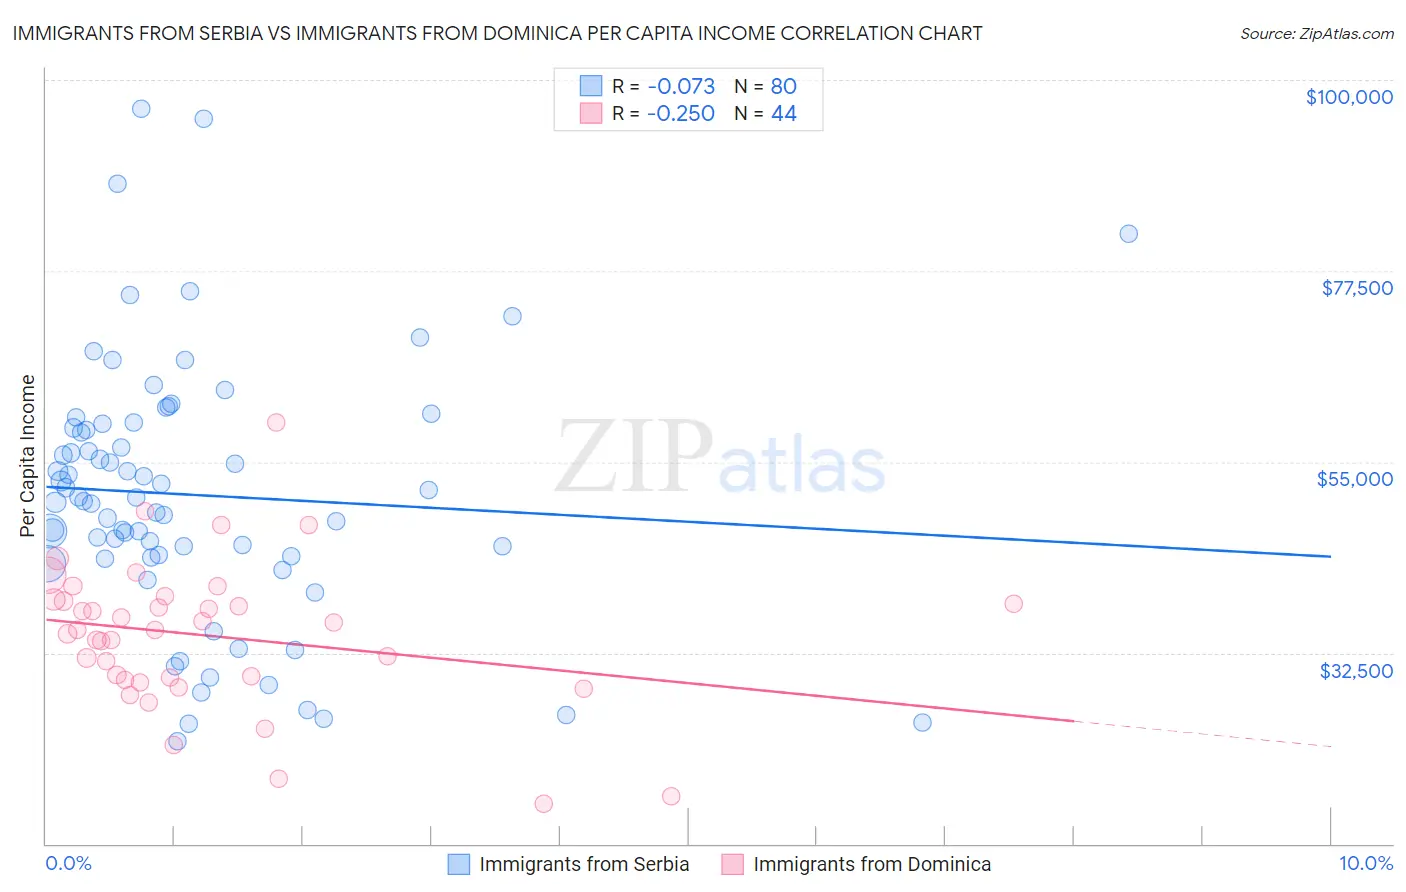
Immigrants from Serbia vs Immigrants from Dominica Per Capita Income Correlation Chart
The statistical analysis conducted on geographies consisting of 131,748,543 people shows a slight negative correlation between the proportion of Immigrants from Serbia and per capita income in the United States with a correlation coefficient (R) of -0.073 and weighted average of $50,810. Similarly, the statistical analysis conducted on geographies consisting of 83,794,667 people shows a weak negative correlation between the proportion of Immigrants from Dominica and per capita income in the United States with a correlation coefficient (R) of -0.250 and weighted average of $37,952, a difference of 33.9%.
Per Capita Income Correlation Summary
| Measurement | Immigrants from Serbia | Immigrants from Dominica |
| Minimum | $22,149 | $14,729 |
| Maximum | $96,565 | $59,651 |
| Range | $74,416 | $44,922 |
| Mean | $51,095 | $34,508 |
| Median | $50,532 | $35,220 |
| Interquartile 25% (IQ1) | $43,814 | $29,494 |
| Interquartile 75% (IQ3) | $59,208 | $38,721 |
| Interquartile Range (IQR) | $15,394 | $9,227 |
| Standard Deviation (Sample) | $15,421 | $8,665 |
| Standard Deviation (Population) | $15,324 | $8,566 |
Similar Demographics by Per Capita Income
Demographics Similar to Immigrants from Serbia by Per Capita Income
In terms of per capita income, the demographic groups most similar to Immigrants from Serbia are Bulgarian ($50,906, a difference of 0.19%), Immigrants from Latvia ($50,914, a difference of 0.21%), Immigrants from Spain ($50,933, a difference of 0.24%), Immigrants from Europe ($50,950, a difference of 0.28%), and New Zealander ($50,575, a difference of 0.46%).
| Demographics | Rating | Rank | Per Capita Income |
| Immigrants | South Africa | 100.0 /100 | #41 | Exceptional $51,465 |
| Immigrants | Turkey | 100.0 /100 | #42 | Exceptional $51,368 |
| Immigrants | Lithuania | 100.0 /100 | #43 | Exceptional $51,361 |
| Immigrants | Europe | 100.0 /100 | #44 | Exceptional $50,950 |
| Immigrants | Spain | 100.0 /100 | #45 | Exceptional $50,933 |
| Immigrants | Latvia | 100.0 /100 | #46 | Exceptional $50,914 |
| Bulgarians | 100.0 /100 | #47 | Exceptional $50,906 |
| Immigrants | Serbia | 100.0 /100 | #48 | Exceptional $50,810 |
| New Zealanders | 100.0 /100 | #49 | Exceptional $50,575 |
| Immigrants | Sri Lanka | 100.0 /100 | #50 | Exceptional $50,555 |
| Immigrants | Netherlands | 100.0 /100 | #51 | Exceptional $50,458 |
| Immigrants | Croatia | 99.9 /100 | #52 | Exceptional $50,417 |
| Paraguayans | 99.9 /100 | #53 | Exceptional $50,385 |
| Immigrants | Belarus | 99.9 /100 | #54 | Exceptional $50,303 |
| Immigrants | Western Europe | 99.9 /100 | #55 | Exceptional $50,065 |
Demographics Similar to Immigrants from Dominica by Per Capita Income
In terms of per capita income, the demographic groups most similar to Immigrants from Dominica are Colville ($38,047, a difference of 0.25%), Potawatomi ($38,046, a difference of 0.25%), Immigrants from Laos ($37,857, a difference of 0.25%), Pennsylvania German ($37,842, a difference of 0.29%), and Immigrants from Nicaragua ($38,065, a difference of 0.30%).
| Demographics | Rating | Rank | Per Capita Income |
| Immigrants | El Salvador | 0.3 /100 | #274 | Tragic $38,394 |
| Immigrants | Liberia | 0.2 /100 | #275 | Tragic $38,165 |
| Hmong | 0.2 /100 | #276 | Tragic $38,120 |
| Comanche | 0.2 /100 | #277 | Tragic $38,088 |
| Immigrants | Nicaragua | 0.2 /100 | #278 | Tragic $38,065 |
| Colville | 0.2 /100 | #279 | Tragic $38,047 |
| Potawatomi | 0.2 /100 | #280 | Tragic $38,046 |
| Immigrants | Dominica | 0.2 /100 | #281 | Tragic $37,952 |
| Immigrants | Laos | 0.1 /100 | #282 | Tragic $37,857 |
| Pennsylvania Germans | 0.1 /100 | #283 | Tragic $37,842 |
| Africans | 0.1 /100 | #284 | Tragic $37,785 |
| Guatemalans | 0.1 /100 | #285 | Tragic $37,766 |
| Central American Indians | 0.1 /100 | #286 | Tragic $37,699 |
| Dominicans | 0.1 /100 | #287 | Tragic $37,697 |
| Blackfeet | 0.1 /100 | #288 | Tragic $37,695 |