Immigrants from Saudi Arabia vs Croatian Householder Income Ages 25 - 44 years
COMPARE
Immigrants from Saudi Arabia
Croatian
Householder Income Ages 25 - 44 years
Householder Income Ages 25 - 44 years Comparison
Immigrants from Saudi Arabia
Croatians
$95,450
HOUSEHOLDER INCOME AGES 25 - 44 YEARS
62.0/ 100
METRIC RATING
163rd/ 347
METRIC RANK
$102,414
HOUSEHOLDER INCOME AGES 25 - 44 YEARS
98.7/ 100
METRIC RATING
91st/ 347
METRIC RANK
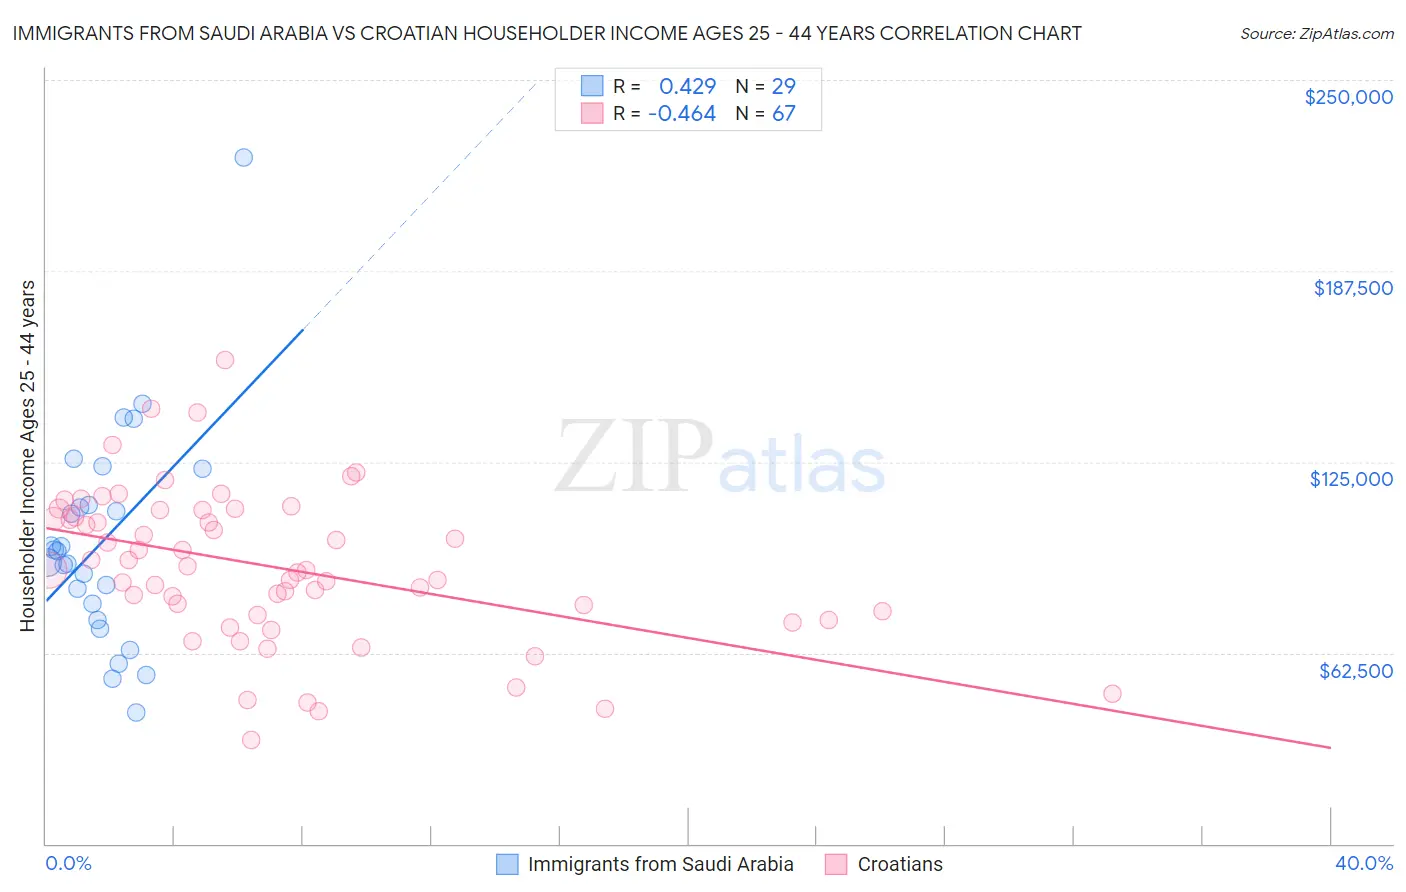
Immigrants from Saudi Arabia vs Croatian Householder Income Ages 25 - 44 years Correlation Chart
The statistical analysis conducted on geographies consisting of 164,160,916 people shows a moderate positive correlation between the proportion of Immigrants from Saudi Arabia and household income with householder between the ages 25 and 44 in the United States with a correlation coefficient (R) of 0.429 and weighted average of $95,450. Similarly, the statistical analysis conducted on geographies consisting of 374,641,532 people shows a moderate negative correlation between the proportion of Croatians and household income with householder between the ages 25 and 44 in the United States with a correlation coefficient (R) of -0.464 and weighted average of $102,414, a difference of 7.3%.
Householder Income Ages 25 - 44 years Correlation Summary
| Measurement | Immigrants from Saudi Arabia | Croatian |
| Minimum | $42,908 | $33,958 |
| Maximum | $224,728 | $158,158 |
| Range | $181,820 | $124,200 |
| Mean | $99,059 | $90,676 |
| Median | $95,793 | $89,581 |
| Interquartile 25% (IQ1) | $75,904 | $75,000 |
| Interquartile 75% (IQ3) | $116,882 | $109,113 |
| Interquartile Range (IQR) | $40,978 | $34,113 |
| Standard Deviation (Sample) | $35,873 | $25,045 |
| Standard Deviation (Population) | $35,249 | $24,857 |
Similar Demographics by Householder Income Ages 25 - 44 years
Demographics Similar to Immigrants from Saudi Arabia by Householder Income Ages 25 - 44 years
In terms of householder income ages 25 - 44 years, the demographic groups most similar to Immigrants from Saudi Arabia are Swiss ($95,511, a difference of 0.060%), Immigrants from Portugal ($95,512, a difference of 0.070%), South American ($95,362, a difference of 0.090%), Icelander ($95,560, a difference of 0.11%), and Costa Rican ($95,565, a difference of 0.12%).
| Demographics | Rating | Rank | Householder Income Ages 25 - 44 years |
| Immigrants | Germany | 67.9 /100 | #156 | Good $95,913 |
| Immigrants | Uganda | 65.2 /100 | #157 | Good $95,698 |
| Scandinavians | 63.9 /100 | #158 | Good $95,596 |
| Costa Ricans | 63.5 /100 | #159 | Good $95,565 |
| Icelanders | 63.4 /100 | #160 | Good $95,560 |
| Immigrants | Portugal | 62.8 /100 | #161 | Good $95,512 |
| Swiss | 62.8 /100 | #162 | Good $95,511 |
| Immigrants | Saudi Arabia | 62.0 /100 | #163 | Good $95,450 |
| South Americans | 60.9 /100 | #164 | Good $95,362 |
| Immigrants | Nepal | 60.3 /100 | #165 | Good $95,322 |
| Immigrants | Ethiopia | 59.5 /100 | #166 | Average $95,256 |
| Czechoslovakians | 57.0 /100 | #167 | Average $95,070 |
| Alsatians | 56.8 /100 | #168 | Average $95,059 |
| Native Hawaiians | 56.8 /100 | #169 | Average $95,058 |
| Slovaks | 56.4 /100 | #170 | Average $95,032 |
Demographics Similar to Croatians by Householder Income Ages 25 - 44 years
In terms of householder income ages 25 - 44 years, the demographic groups most similar to Croatians are Immigrants from North America ($102,407, a difference of 0.010%), Ukrainian ($102,451, a difference of 0.040%), Romanian ($102,544, a difference of 0.13%), Immigrants from Canada ($102,616, a difference of 0.20%), and Immigrants from Western Europe ($102,654, a difference of 0.23%).
| Demographics | Rating | Rank | Householder Income Ages 25 - 44 years |
| Immigrants | Philippines | 99.0 /100 | #84 | Exceptional $102,910 |
| Immigrants | Ukraine | 98.9 /100 | #85 | Exceptional $102,664 |
| Immigrants | Hungary | 98.9 /100 | #86 | Exceptional $102,655 |
| Immigrants | Western Europe | 98.9 /100 | #87 | Exceptional $102,654 |
| Immigrants | Canada | 98.9 /100 | #88 | Exceptional $102,616 |
| Romanians | 98.8 /100 | #89 | Exceptional $102,544 |
| Ukrainians | 98.8 /100 | #90 | Exceptional $102,451 |
| Croatians | 98.7 /100 | #91 | Exceptional $102,414 |
| Immigrants | North America | 98.7 /100 | #92 | Exceptional $102,407 |
| Immigrants | England | 98.4 /100 | #93 | Exceptional $102,020 |
| Sri Lankans | 98.4 /100 | #94 | Exceptional $101,960 |
| Assyrians/Chaldeans/Syriacs | 98.3 /100 | #95 | Exceptional $101,936 |
| Macedonians | 98.3 /100 | #96 | Exceptional $101,882 |
| Austrians | 98.3 /100 | #97 | Exceptional $101,842 |
| Immigrants | Kazakhstan | 98.1 /100 | #98 | Exceptional $101,727 |