Immigrants from Saudi Arabia vs Marshallese Householder Income Ages 25 - 44 years
COMPARE
Immigrants from Saudi Arabia
Marshallese
Householder Income Ages 25 - 44 years
Householder Income Ages 25 - 44 years Comparison
Immigrants from Saudi Arabia
Marshallese
$95,450
HOUSEHOLDER INCOME AGES 25 - 44 YEARS
62.0/ 100
METRIC RATING
163rd/ 347
METRIC RANK
$83,575
HOUSEHOLDER INCOME AGES 25 - 44 YEARS
0.2/ 100
METRIC RATING
274th/ 347
METRIC RANK
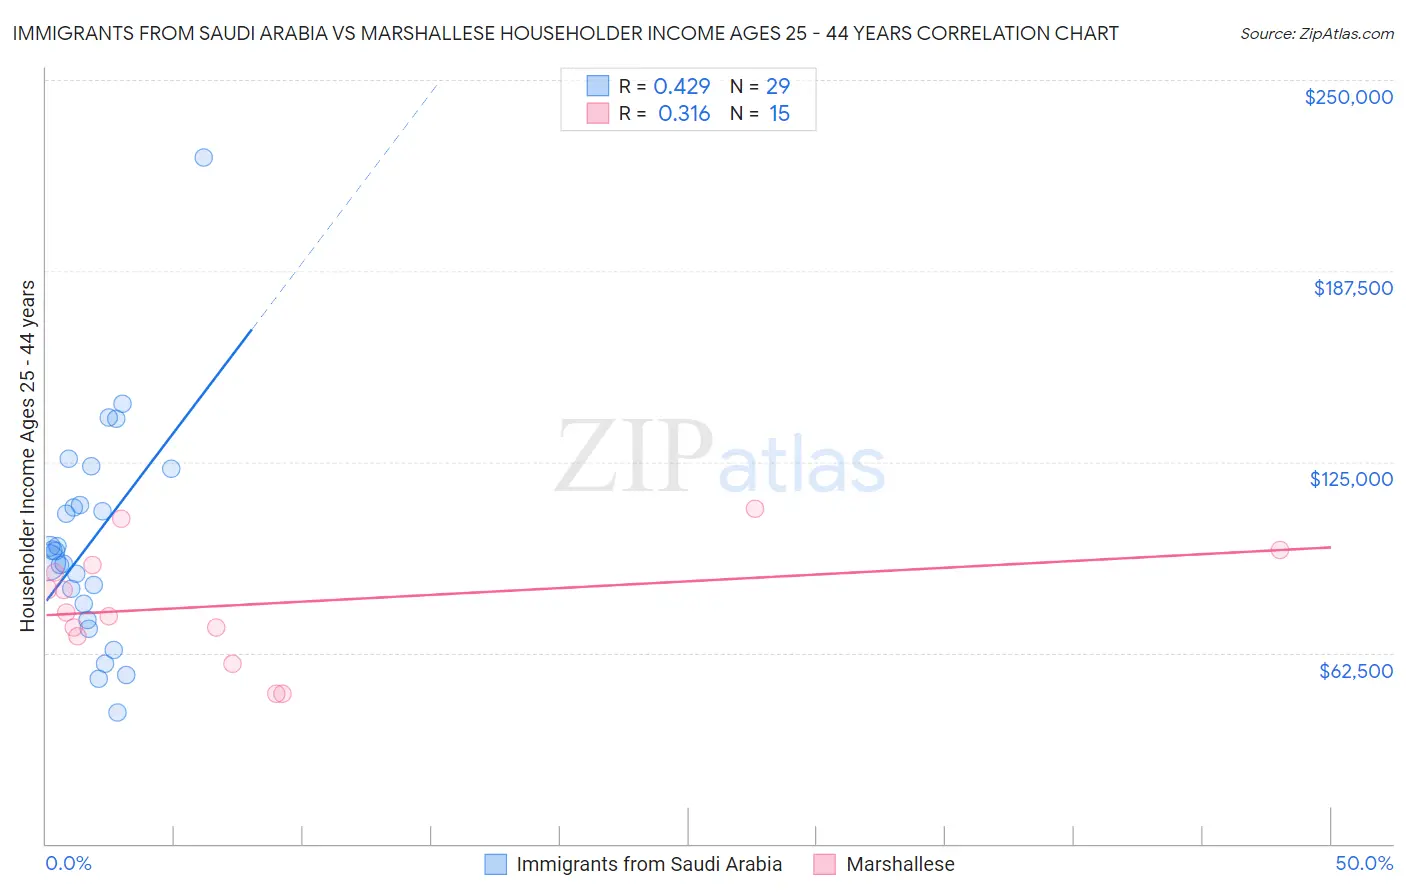
Immigrants from Saudi Arabia vs Marshallese Householder Income Ages 25 - 44 years Correlation Chart
The statistical analysis conducted on geographies consisting of 164,160,916 people shows a moderate positive correlation between the proportion of Immigrants from Saudi Arabia and household income with householder between the ages 25 and 44 in the United States with a correlation coefficient (R) of 0.429 and weighted average of $95,450. Similarly, the statistical analysis conducted on geographies consisting of 14,753,881 people shows a mild positive correlation between the proportion of Marshallese and household income with householder between the ages 25 and 44 in the United States with a correlation coefficient (R) of 0.316 and weighted average of $83,575, a difference of 14.2%.
Householder Income Ages 25 - 44 years Correlation Summary
| Measurement | Immigrants from Saudi Arabia | Marshallese |
| Minimum | $42,908 | $48,906 |
| Maximum | $224,728 | $109,583 |
| Range | $181,820 | $60,677 |
| Mean | $99,059 | $78,342 |
| Median | $95,793 | $75,712 |
| Interquartile 25% (IQ1) | $75,904 | $67,813 |
| Interquartile 75% (IQ3) | $116,882 | $91,124 |
| Interquartile Range (IQR) | $40,978 | $23,311 |
| Standard Deviation (Sample) | $35,873 | $18,418 |
| Standard Deviation (Population) | $35,249 | $17,794 |
Similar Demographics by Householder Income Ages 25 - 44 years
Demographics Similar to Immigrants from Saudi Arabia by Householder Income Ages 25 - 44 years
In terms of householder income ages 25 - 44 years, the demographic groups most similar to Immigrants from Saudi Arabia are Swiss ($95,511, a difference of 0.060%), Immigrants from Portugal ($95,512, a difference of 0.070%), South American ($95,362, a difference of 0.090%), Icelander ($95,560, a difference of 0.11%), and Costa Rican ($95,565, a difference of 0.12%).
| Demographics | Rating | Rank | Householder Income Ages 25 - 44 years |
| Immigrants | Germany | 67.9 /100 | #156 | Good $95,913 |
| Immigrants | Uganda | 65.2 /100 | #157 | Good $95,698 |
| Scandinavians | 63.9 /100 | #158 | Good $95,596 |
| Costa Ricans | 63.5 /100 | #159 | Good $95,565 |
| Icelanders | 63.4 /100 | #160 | Good $95,560 |
| Immigrants | Portugal | 62.8 /100 | #161 | Good $95,512 |
| Swiss | 62.8 /100 | #162 | Good $95,511 |
| Immigrants | Saudi Arabia | 62.0 /100 | #163 | Good $95,450 |
| South Americans | 60.9 /100 | #164 | Good $95,362 |
| Immigrants | Nepal | 60.3 /100 | #165 | Good $95,322 |
| Immigrants | Ethiopia | 59.5 /100 | #166 | Average $95,256 |
| Czechoslovakians | 57.0 /100 | #167 | Average $95,070 |
| Alsatians | 56.8 /100 | #168 | Average $95,059 |
| Native Hawaiians | 56.8 /100 | #169 | Average $95,058 |
| Slovaks | 56.4 /100 | #170 | Average $95,032 |
Demographics Similar to Marshallese by Householder Income Ages 25 - 44 years
In terms of householder income ages 25 - 44 years, the demographic groups most similar to Marshallese are Iroquois ($83,682, a difference of 0.13%), Spanish American ($83,722, a difference of 0.18%), Somali ($83,752, a difference of 0.21%), Immigrants from Jamaica ($83,298, a difference of 0.33%), and Jamaican ($83,933, a difference of 0.43%).
| Demographics | Rating | Rank | Householder Income Ages 25 - 44 years |
| Hmong | 0.3 /100 | #267 | Tragic $84,258 |
| Sub-Saharan Africans | 0.3 /100 | #268 | Tragic $84,235 |
| Spanish American Indians | 0.3 /100 | #269 | Tragic $84,085 |
| Jamaicans | 0.3 /100 | #270 | Tragic $83,933 |
| Somalis | 0.2 /100 | #271 | Tragic $83,752 |
| Spanish Americans | 0.2 /100 | #272 | Tragic $83,722 |
| Iroquois | 0.2 /100 | #273 | Tragic $83,682 |
| Marshallese | 0.2 /100 | #274 | Tragic $83,575 |
| Immigrants | Jamaica | 0.2 /100 | #275 | Tragic $83,298 |
| Immigrants | Belize | 0.2 /100 | #276 | Tragic $83,141 |
| Paiute | 0.2 /100 | #277 | Tragic $82,984 |
| Senegalese | 0.2 /100 | #278 | Tragic $82,852 |
| Pima | 0.1 /100 | #279 | Tragic $82,821 |
| Colville | 0.1 /100 | #280 | Tragic $82,604 |
| Cajuns | 0.1 /100 | #281 | Tragic $82,393 |