Immigrants from Saudi Arabia vs Croatian In Labor Force | Age > 16
COMPARE
Immigrants from Saudi Arabia
Croatian
In Labor Force | Age > 16
In Labor Force | Age > 16 Comparison
Immigrants from Saudi Arabia
Croatians
66.3%
IN LABOR FORCE | AGE > 16
99.9/ 100
METRIC RATING
58th/ 347
METRIC RANK
64.7%
IN LABOR FORCE | AGE > 16
8.8/ 100
METRIC RATING
225th/ 347
METRIC RANK
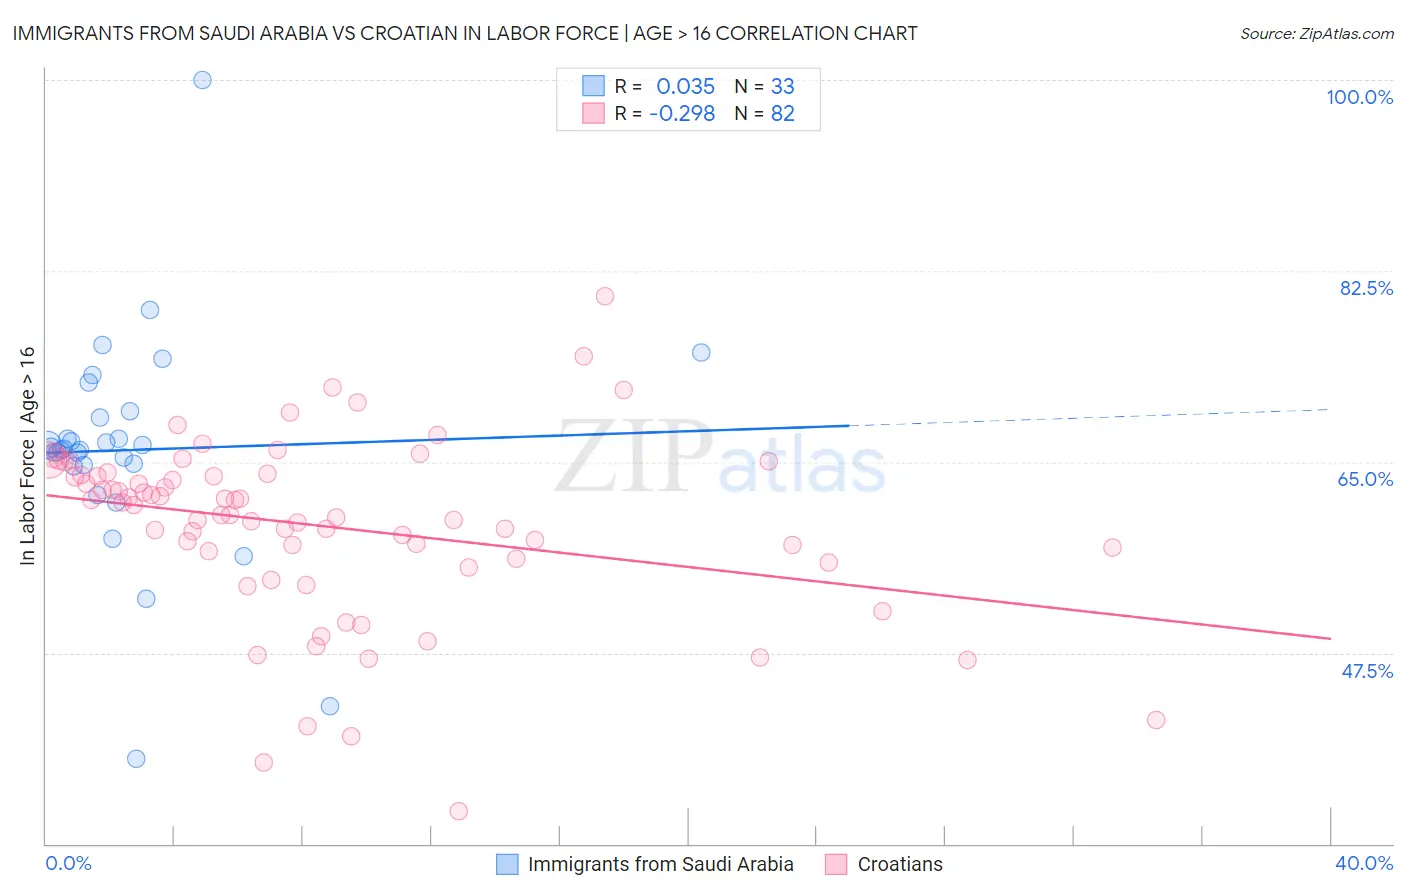
Immigrants from Saudi Arabia vs Croatian In Labor Force | Age > 16 Correlation Chart
The statistical analysis conducted on geographies consisting of 164,297,187 people shows no correlation between the proportion of Immigrants from Saudi Arabia and labor force participation rate among population ages 16 and over in the United States with a correlation coefficient (R) of 0.035 and weighted average of 66.3%. Similarly, the statistical analysis conducted on geographies consisting of 375,747,004 people shows a weak negative correlation between the proportion of Croatians and labor force participation rate among population ages 16 and over in the United States with a correlation coefficient (R) of -0.298 and weighted average of 64.7%, a difference of 2.5%.
In Labor Force | Age > 16 Correlation Summary
| Measurement | Immigrants from Saudi Arabia | Croatian |
| Minimum | 37.8% | 33.0% |
| Maximum | 100.0% | 80.2% |
| Range | 62.2% | 47.2% |
| Mean | 66.1% | 59.1% |
| Median | 66.2% | 60.6% |
| Interquartile 25% (IQ1) | 64.7% | 56.1% |
| Interquartile 75% (IQ3) | 69.4% | 63.8% |
| Interquartile Range (IQR) | 4.7% | 7.7% |
| Standard Deviation (Sample) | 10.3% | 8.3% |
| Standard Deviation (Population) | 10.2% | 8.2% |
Similar Demographics by In Labor Force | Age > 16
Demographics Similar to Immigrants from Saudi Arabia by In Labor Force | Age > 16
In terms of in labor force | age > 16, the demographic groups most similar to Immigrants from Saudi Arabia are Immigrants from Turkey (66.3%, a difference of 0.020%), Immigrants from Peru (66.3%, a difference of 0.050%), Immigrants from Burma/Myanmar (66.3%, a difference of 0.050%), Indonesian (66.3%, a difference of 0.050%), and Venezuelan (66.3%, a difference of 0.090%).
| Demographics | Rating | Rank | In Labor Force | Age > 16 |
| Immigrants | Kuwait | 100.0 /100 | #51 | Exceptional 66.5% |
| Paraguayans | 99.9 /100 | #52 | Exceptional 66.5% |
| Immigrants | Sri Lanka | 99.9 /100 | #53 | Exceptional 66.5% |
| Immigrants | Bosnia and Herzegovina | 99.9 /100 | #54 | Exceptional 66.5% |
| Immigrants | Venezuela | 99.9 /100 | #55 | Exceptional 66.4% |
| Immigrants | Senegal | 99.9 /100 | #56 | Exceptional 66.4% |
| Bulgarians | 99.9 /100 | #57 | Exceptional 66.4% |
| Immigrants | Saudi Arabia | 99.9 /100 | #58 | Exceptional 66.3% |
| Immigrants | Turkey | 99.9 /100 | #59 | Exceptional 66.3% |
| Immigrants | Peru | 99.8 /100 | #60 | Exceptional 66.3% |
| Immigrants | Burma/Myanmar | 99.8 /100 | #61 | Exceptional 66.3% |
| Indonesians | 99.8 /100 | #62 | Exceptional 66.3% |
| Venezuelans | 99.8 /100 | #63 | Exceptional 66.3% |
| Peruvians | 99.8 /100 | #64 | Exceptional 66.3% |
| Sri Lankans | 99.8 /100 | #65 | Exceptional 66.3% |
Demographics Similar to Croatians by In Labor Force | Age > 16
In terms of in labor force | age > 16, the demographic groups most similar to Croatians are Immigrants from Jamaica (64.7%, a difference of 0.0%), Immigrants from Belize (64.7%, a difference of 0.010%), Hawaiian (64.7%, a difference of 0.020%), European (64.7%, a difference of 0.020%), and Polish (64.7%, a difference of 0.020%).
| Demographics | Rating | Rank | In Labor Force | Age > 16 |
| Alsatians | 10.7 /100 | #218 | Poor 64.7% |
| Immigrants | Central America | 10.5 /100 | #219 | Poor 64.7% |
| Alaska Natives | 9.9 /100 | #220 | Tragic 64.7% |
| Immigrants | Micronesia | 9.6 /100 | #221 | Tragic 64.7% |
| Hawaiians | 9.3 /100 | #222 | Tragic 64.7% |
| Immigrants | Belize | 9.2 /100 | #223 | Tragic 64.7% |
| Immigrants | Jamaica | 8.8 /100 | #224 | Tragic 64.7% |
| Croatians | 8.8 /100 | #225 | Tragic 64.7% |
| Europeans | 8.3 /100 | #226 | Tragic 64.7% |
| Poles | 8.3 /100 | #227 | Tragic 64.7% |
| Northern Europeans | 8.2 /100 | #228 | Tragic 64.7% |
| British | 7.3 /100 | #229 | Tragic 64.7% |
| Chinese | 7.3 /100 | #230 | Tragic 64.7% |
| Immigrants | Northern Europe | 7.2 /100 | #231 | Tragic 64.7% |
| Africans | 5.8 /100 | #232 | Tragic 64.6% |