Immigrants from Saudi Arabia vs Yugoslavian Householder Income Ages 25 - 44 years
COMPARE
Immigrants from Saudi Arabia
Yugoslavian
Householder Income Ages 25 - 44 years
Householder Income Ages 25 - 44 years Comparison
Immigrants from Saudi Arabia
Yugoslavians
$95,450
HOUSEHOLDER INCOME AGES 25 - 44 YEARS
62.0/ 100
METRIC RATING
163rd/ 347
METRIC RANK
$91,368
HOUSEHOLDER INCOME AGES 25 - 44 YEARS
14.5/ 100
METRIC RATING
207th/ 347
METRIC RANK
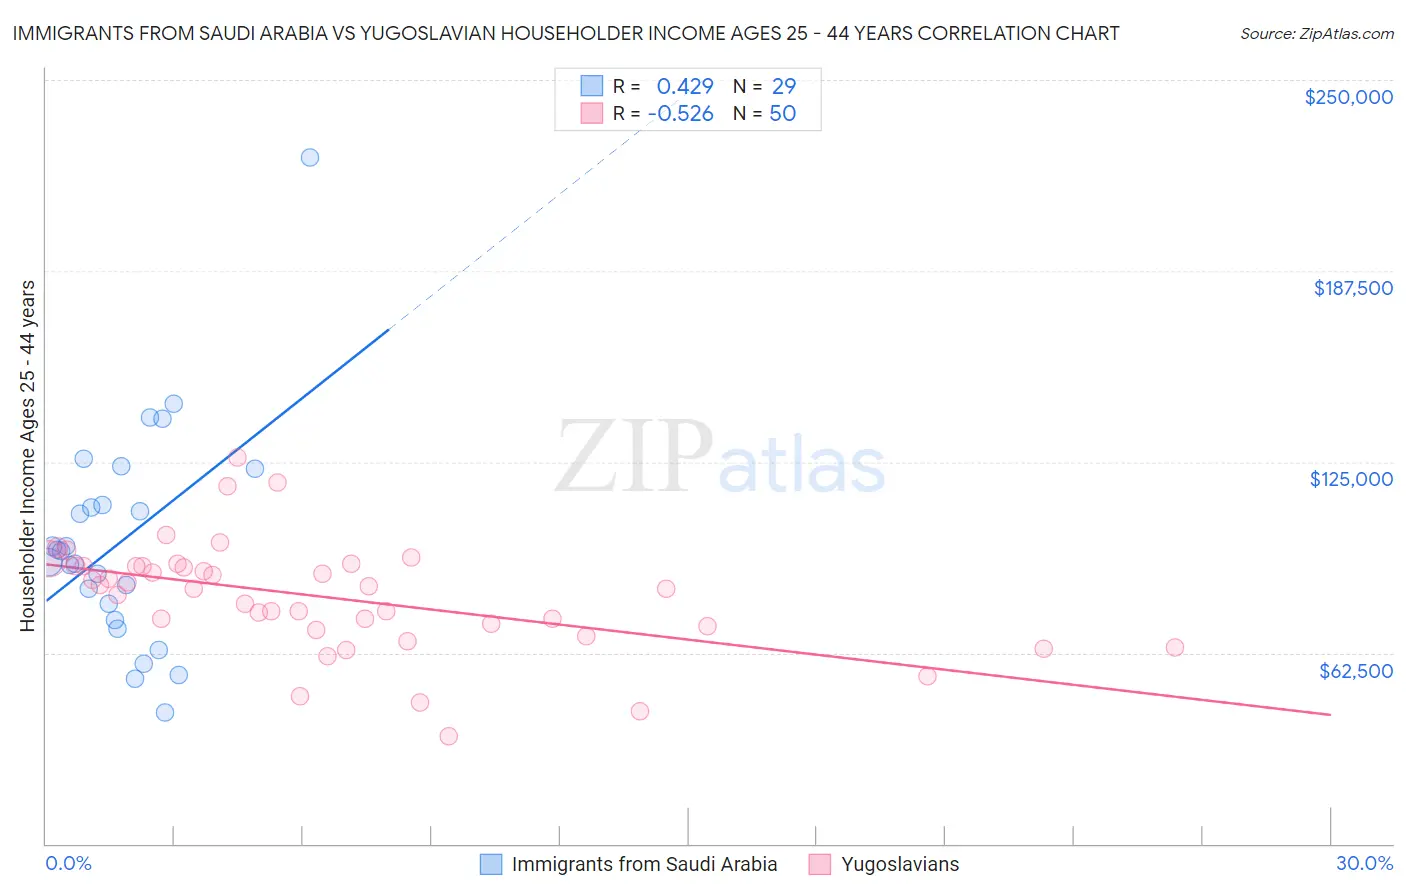
Immigrants from Saudi Arabia vs Yugoslavian Householder Income Ages 25 - 44 years Correlation Chart
The statistical analysis conducted on geographies consisting of 164,160,916 people shows a moderate positive correlation between the proportion of Immigrants from Saudi Arabia and household income with householder between the ages 25 and 44 in the United States with a correlation coefficient (R) of 0.429 and weighted average of $95,450. Similarly, the statistical analysis conducted on geographies consisting of 285,145,495 people shows a substantial negative correlation between the proportion of Yugoslavians and household income with householder between the ages 25 and 44 in the United States with a correlation coefficient (R) of -0.526 and weighted average of $91,368, a difference of 4.5%.
Householder Income Ages 25 - 44 years Correlation Summary
| Measurement | Immigrants from Saudi Arabia | Yugoslavian |
| Minimum | $42,908 | $35,313 |
| Maximum | $224,728 | $126,461 |
| Range | $181,820 | $91,148 |
| Mean | $99,059 | $80,797 |
| Median | $95,793 | $83,915 |
| Interquartile 25% (IQ1) | $75,904 | $71,042 |
| Interquartile 75% (IQ3) | $116,882 | $90,884 |
| Interquartile Range (IQR) | $40,978 | $19,842 |
| Standard Deviation (Sample) | $35,873 | $18,085 |
| Standard Deviation (Population) | $35,249 | $17,903 |
Similar Demographics by Householder Income Ages 25 - 44 years
Demographics Similar to Immigrants from Saudi Arabia by Householder Income Ages 25 - 44 years
In terms of householder income ages 25 - 44 years, the demographic groups most similar to Immigrants from Saudi Arabia are Swiss ($95,511, a difference of 0.060%), Immigrants from Portugal ($95,512, a difference of 0.070%), South American ($95,362, a difference of 0.090%), Icelander ($95,560, a difference of 0.11%), and Costa Rican ($95,565, a difference of 0.12%).
| Demographics | Rating | Rank | Householder Income Ages 25 - 44 years |
| Immigrants | Germany | 67.9 /100 | #156 | Good $95,913 |
| Immigrants | Uganda | 65.2 /100 | #157 | Good $95,698 |
| Scandinavians | 63.9 /100 | #158 | Good $95,596 |
| Costa Ricans | 63.5 /100 | #159 | Good $95,565 |
| Icelanders | 63.4 /100 | #160 | Good $95,560 |
| Immigrants | Portugal | 62.8 /100 | #161 | Good $95,512 |
| Swiss | 62.8 /100 | #162 | Good $95,511 |
| Immigrants | Saudi Arabia | 62.0 /100 | #163 | Good $95,450 |
| South Americans | 60.9 /100 | #164 | Good $95,362 |
| Immigrants | Nepal | 60.3 /100 | #165 | Good $95,322 |
| Immigrants | Ethiopia | 59.5 /100 | #166 | Average $95,256 |
| Czechoslovakians | 57.0 /100 | #167 | Average $95,070 |
| Alsatians | 56.8 /100 | #168 | Average $95,059 |
| Native Hawaiians | 56.8 /100 | #169 | Average $95,058 |
| Slovaks | 56.4 /100 | #170 | Average $95,032 |
Demographics Similar to Yugoslavians by Householder Income Ages 25 - 44 years
In terms of householder income ages 25 - 44 years, the demographic groups most similar to Yugoslavians are Aleut ($91,370, a difference of 0.0%), Immigrants from Thailand ($91,337, a difference of 0.030%), Immigrants from Eastern Africa ($91,458, a difference of 0.10%), Nepalese ($91,498, a difference of 0.14%), and Immigrants from Cambodia ($91,533, a difference of 0.18%).
| Demographics | Rating | Rank | Householder Income Ages 25 - 44 years |
| Whites/Caucasians | 16.7 /100 | #200 | Poor $91,668 |
| Japanese | 16.4 /100 | #201 | Poor $91,624 |
| Ecuadorians | 16.0 /100 | #202 | Poor $91,574 |
| Immigrants | Cambodia | 15.7 /100 | #203 | Poor $91,533 |
| Nepalese | 15.4 /100 | #204 | Poor $91,498 |
| Immigrants | Eastern Africa | 15.2 /100 | #205 | Poor $91,458 |
| Aleuts | 14.5 /100 | #206 | Poor $91,370 |
| Yugoslavians | 14.5 /100 | #207 | Poor $91,368 |
| Immigrants | Thailand | 14.3 /100 | #208 | Poor $91,337 |
| Immigrants | Uruguay | 13.2 /100 | #209 | Poor $91,171 |
| Immigrants | Kenya | 10.9 /100 | #210 | Poor $90,767 |
| Iraqis | 10.8 /100 | #211 | Poor $90,764 |
| Hawaiians | 10.6 /100 | #212 | Poor $90,722 |
| Immigrants | Bangladesh | 9.3 /100 | #213 | Tragic $90,448 |
| Immigrants | Africa | 8.9 /100 | #214 | Tragic $90,372 |