Immigrants from Southern Europe vs Croatian Householder Income Ages 25 - 44 years
COMPARE
Immigrants from Southern Europe
Croatian
Householder Income Ages 25 - 44 years
Householder Income Ages 25 - 44 years Comparison
Immigrants from Southern Europe
Croatians
$103,486
HOUSEHOLDER INCOME AGES 25 - 44 YEARS
99.3/ 100
METRIC RATING
77th/ 347
METRIC RANK
$102,414
HOUSEHOLDER INCOME AGES 25 - 44 YEARS
98.7/ 100
METRIC RATING
91st/ 347
METRIC RANK
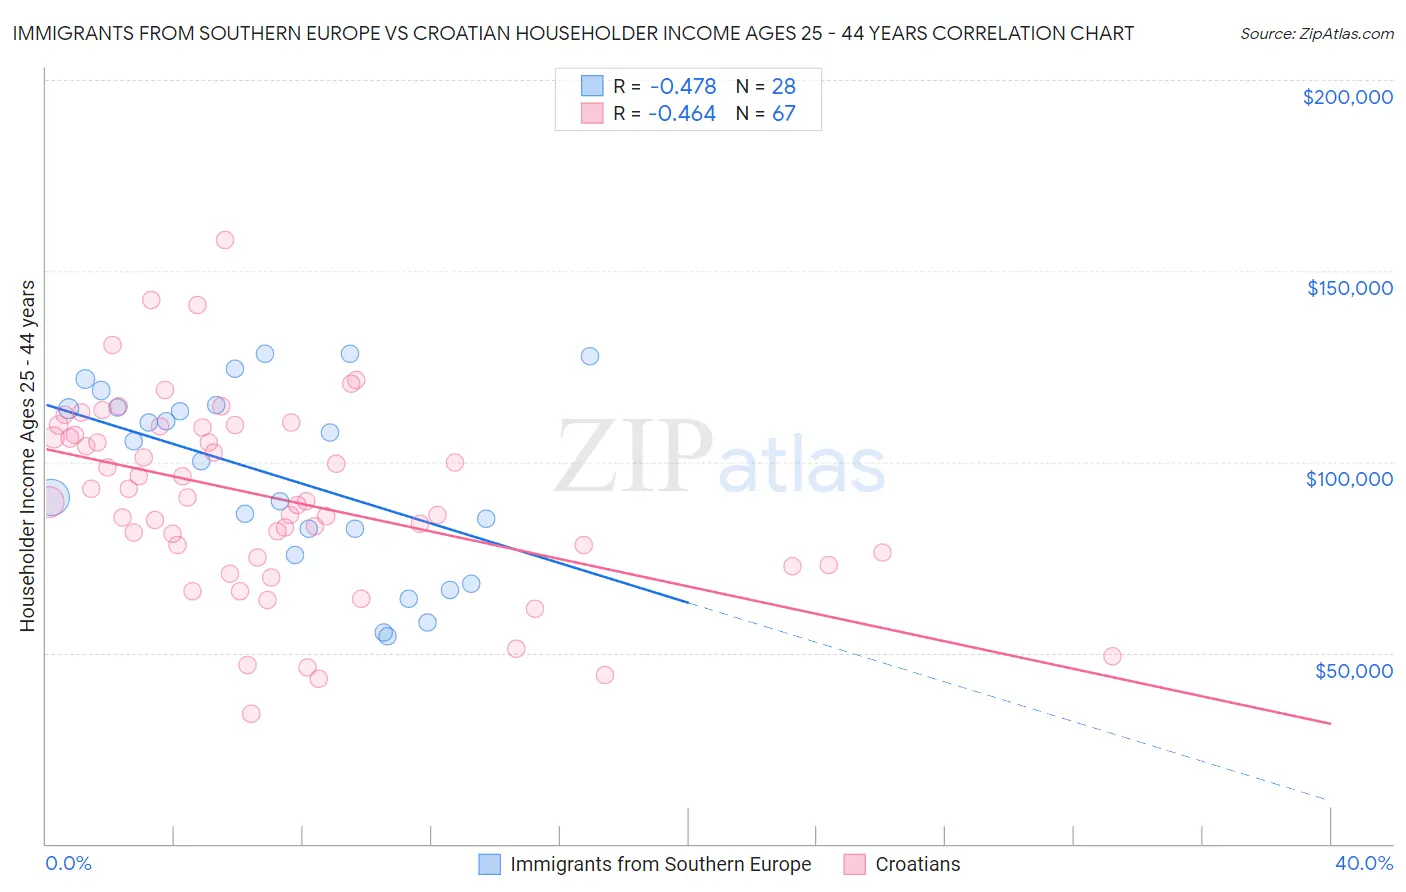
Immigrants from Southern Europe vs Croatian Householder Income Ages 25 - 44 years Correlation Chart
The statistical analysis conducted on geographies consisting of 401,612,354 people shows a moderate negative correlation between the proportion of Immigrants from Southern Europe and household income with householder between the ages 25 and 44 in the United States with a correlation coefficient (R) of -0.478 and weighted average of $103,486. Similarly, the statistical analysis conducted on geographies consisting of 374,641,532 people shows a moderate negative correlation between the proportion of Croatians and household income with householder between the ages 25 and 44 in the United States with a correlation coefficient (R) of -0.464 and weighted average of $102,414, a difference of 1.1%.
Householder Income Ages 25 - 44 years Correlation Summary
| Measurement | Immigrants from Southern Europe | Croatian |
| Minimum | $54,315 | $33,958 |
| Maximum | $128,289 | $158,158 |
| Range | $73,974 | $124,200 |
| Mean | $96,371 | $90,676 |
| Median | $102,776 | $89,581 |
| Interquartile 25% (IQ1) | $78,949 | $75,000 |
| Interquartile 75% (IQ3) | $114,674 | $109,113 |
| Interquartile Range (IQR) | $35,724 | $34,113 |
| Standard Deviation (Sample) | $24,047 | $25,045 |
| Standard Deviation (Population) | $23,614 | $24,857 |
Demographics Similar to Immigrants from Southern Europe and Croatians by Householder Income Ages 25 - 44 years
In terms of householder income ages 25 - 44 years, the demographic groups most similar to Immigrants from Southern Europe are Immigrants from Bulgaria ($103,423, a difference of 0.060%), Armenian ($103,248, a difference of 0.23%), Immigrants from Spain ($103,752, a difference of 0.26%), Immigrants from Egypt ($103,192, a difference of 0.28%), and South African ($103,160, a difference of 0.32%). Similarly, the demographic groups most similar to Croatians are Immigrants from North America ($102,407, a difference of 0.010%), Ukrainian ($102,451, a difference of 0.040%), Romanian ($102,544, a difference of 0.13%), Immigrants from Canada ($102,616, a difference of 0.20%), and Immigrants from Western Europe ($102,654, a difference of 0.23%).
| Demographics | Rating | Rank | Householder Income Ages 25 - 44 years |
| Immigrants | Fiji | 99.5 /100 | #74 | Exceptional $103,954 |
| Koreans | 99.4 /100 | #75 | Exceptional $103,824 |
| Immigrants | Spain | 99.4 /100 | #76 | Exceptional $103,752 |
| Immigrants | Southern Europe | 99.3 /100 | #77 | Exceptional $103,486 |
| Immigrants | Bulgaria | 99.3 /100 | #78 | Exceptional $103,423 |
| Armenians | 99.2 /100 | #79 | Exceptional $103,248 |
| Immigrants | Egypt | 99.2 /100 | #80 | Exceptional $103,192 |
| South Africans | 99.2 /100 | #81 | Exceptional $103,160 |
| Immigrants | Serbia | 99.2 /100 | #82 | Exceptional $103,155 |
| Argentineans | 99.1 /100 | #83 | Exceptional $103,111 |
| Immigrants | Philippines | 99.0 /100 | #84 | Exceptional $102,910 |
| Immigrants | Ukraine | 98.9 /100 | #85 | Exceptional $102,664 |
| Immigrants | Hungary | 98.9 /100 | #86 | Exceptional $102,655 |
| Immigrants | Western Europe | 98.9 /100 | #87 | Exceptional $102,654 |
| Immigrants | Canada | 98.9 /100 | #88 | Exceptional $102,616 |
| Romanians | 98.8 /100 | #89 | Exceptional $102,544 |
| Ukrainians | 98.8 /100 | #90 | Exceptional $102,451 |
| Croatians | 98.7 /100 | #91 | Exceptional $102,414 |
| Immigrants | North America | 98.7 /100 | #92 | Exceptional $102,407 |
| Immigrants | England | 98.4 /100 | #93 | Exceptional $102,020 |
| Sri Lankans | 98.4 /100 | #94 | Exceptional $101,960 |